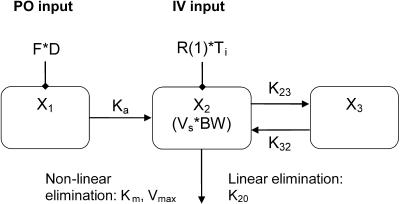
FIG. 2.
Structural models for pharmacokinetic analysis. Model equations are as follows.


For linear models:

For nonlinear models:

D, dose; F, bioavailability; Ka, absorption rate constant; R(1), rate of infusion into central compartment; Ti, infusion time; Vs, volume of central compartment normalized to body weight; K23, rate constant from central to peripheral compartment; K32, rate constant from peripheral to central compartment. For nondistributive models, K23 and K32 were fixed at 0.0. Nonlinear elimination: Vmax, maximum velocity; Km, Michaelis-Menten constant; linear elimination, K20 (elimination rate constant).

