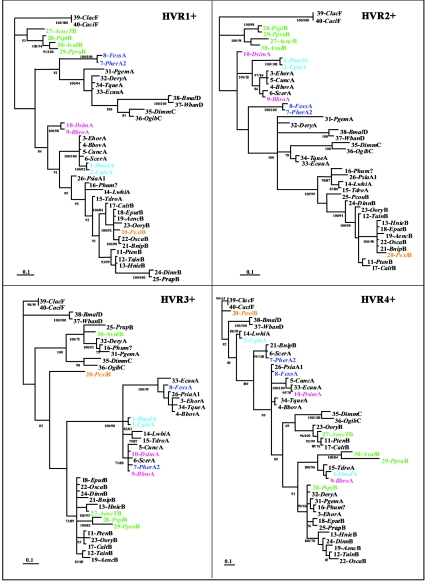
FIG. 4.
Phylogenetic trees of the four portions of wsp encompassing single HVR+s (135 bp each). The trees were generated by MrBayes (100,000 replicates, 50% majority rule) and are unrooted. Sequence identification corresponds to the description provided in Table 1. Colors highlight some of the examples discussed in the text (see Results) and show changes in phylogenetic association across HVR+s affecting all sequences shown. Sequences of supergroups A and B do not form separate groupings at any HVR. Posterior probability values higher than 70% are shown at the nodes. For nodes supported also by parsimonious analyses, the corresponding bootstrap value is shown under the posterior probabilities.

