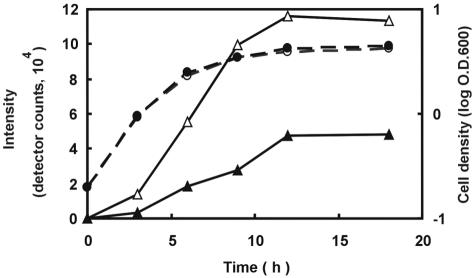
FIG. 9.
Time course of LamD558 production in culture filtrates of wild-type and lamA mutant strains grown in CDM. Solid line shows LamD558 intensity (open triangle, wild-type strain; closed triangle, lamA mutant strain). Broken line shows the optical density of cultures at 600 nm (log O.D.600) (open circle, wild-type strain; closed circle, lamA mutant strain). Culture filtrates were collected and analyzed by LC/MS. Overnight cultures were inoculated into CDM to an OD600 of 0.15 and cultured at 30°C. Culture filtrates were collected at the indicated times and analyzed by LC/MS as described in Materials and Methods. The height of the LamD558 peak in each extracted ion chromatogram at a m/z value of 559 was plotted in the graph.

