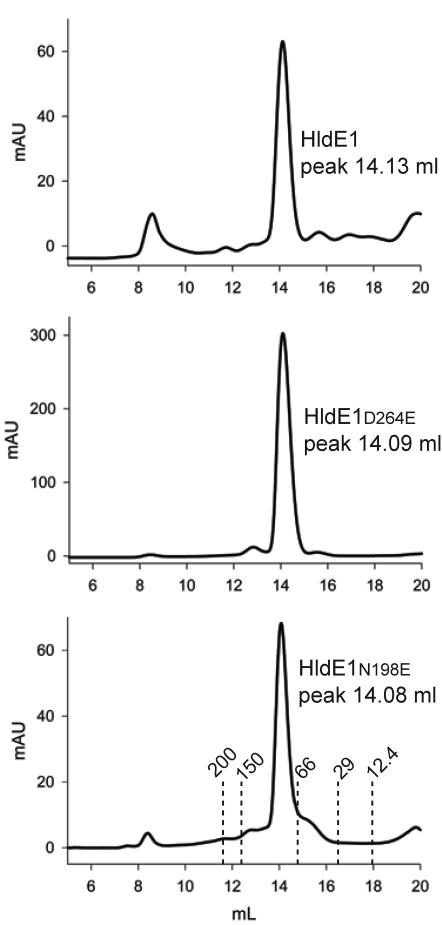
FIG. 8.
Size exclusion chromatography profiles obtained with wild-type HldE1, HldE1D264E, and HldE1N198E. The x axis corresponds to milliliters passed over the column, and the y axis indicates the absorption read in the detector at 280 nm. The height of the peak depends on the relative concentration of protein loaded into the column. Standards used to calibrate the column were blue dextran (2000 kDa), β-amylase (200 kDa), alcohol dehydrogenase (150 kDa), bovine serum albumin (66 kDa), carbonic anhydrase (29 kDa), and cytochrome c (12.4 kDa). The predominant peak of elution (14.1 ml) in all cases corresponded to an approximate mass of 83 kDa, which is consistent with expected mass of the dimeric form of HldE1.

