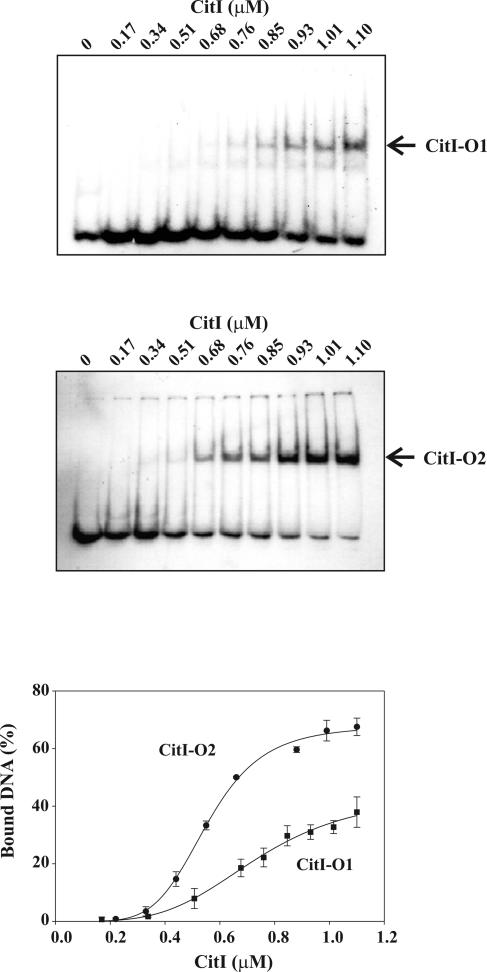
FIG. 3.
Citrate effect on CitI affinity to DNA. The top panels show gel shift assays performed by use of CitI and end-labeled amplicon B and amplicon C including either O1 or O2, respectively. Complexes CitI-O1 and CitI-O2 are indicated with arrows. The bottom panel shows the quantification of radioactivity present in the complexes obtained in each experiment shown in the upper panels and a plot of the percentages of bound DNA as functions of CitI concentration. The values given in the plot correspond to means of three independent experiments.

