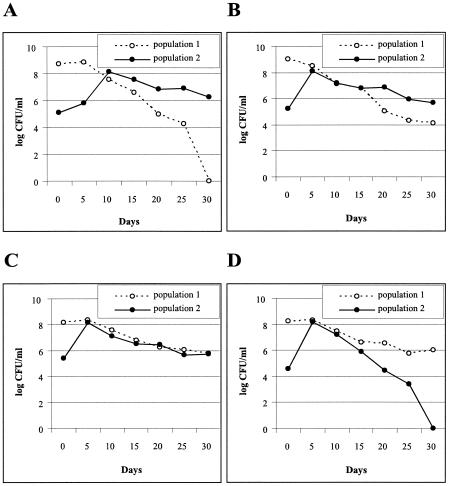
FIG. 3.
Representative examples of GASP competition phenotypes which appeared during the cocultivation of aged and nonaged subpopulations of P. putida. For simplification, the competing subpopulations are marked as population 1 and population 2. Different expression levels of the GASP phenotype are shown for population 1, which consists of cells derived from a 1-day-old (nonaged) culture, and for population 2, derived from an 8-day-old (aged) culture. Population 2 was able to out-compete population 1 either completely (strong GASP phenotype, panel A) or partially (mild GASP phenotype, panel B) or displayed an equal fitness to that of population 1 (equal GASP phenotype, panel C). In some cases, population 2 was either partially or completely out-competed by population 1 (no GASP phenotype, panel D).

