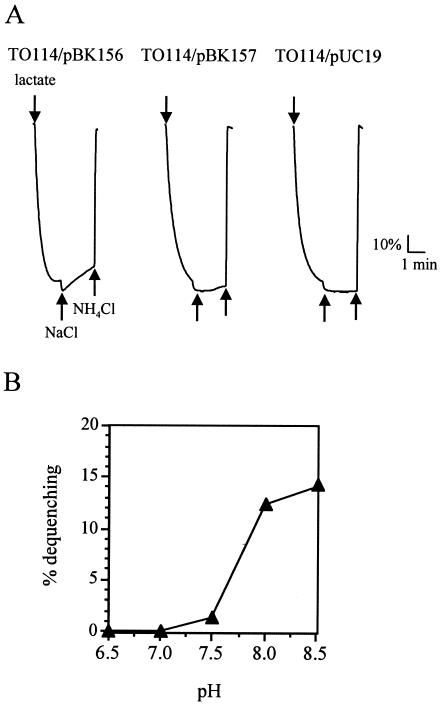
FIG. 3.
Na+/H+ antiport activities measured by the fluorescence quenching method. (A) Everted membrane vesicles were prepared from cells of E. coli TO114 with pBK156, pBK157, or pUC19 grown in LBK medium. The first arrow indicates the addition of 10 mM Tris-lactate to initiate fluorescence quenching due to the inward movement of H+ by respiration. The second and third arrows indicate the additions of 10 mM NaCl and 25 mM NH4Cl, respectively. (B) The pH profile of the antiport activity conferred by the sha homologue cluster. Each value is shown as the mean of three replicates.

