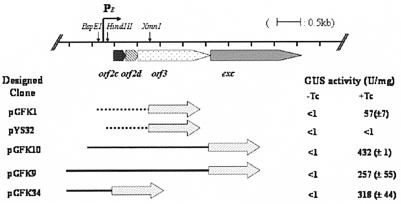
FIG. 2.
Fusion constructs and deletions in the promoter region of the orf2c excision gene cluster (PE) fused to uidA. At the top of the figure is a map of the orf2c operon and its promoter region (PE). The locations of important restriction sites are indicated. Below the map are various constructs containing the portions of the upstream region that were fused to uidA. The filled arrows show the location of the fusion point between the uidA gene and the promoter region segments. The constructs with dashed lines are transcriptional fusions and the constructs with solid lines are translational fusions to the uidA reporter gene. Each construct was transferred into BT4001ΩQABC, which contains the regulatory genes of CTnDOT integrated in the chromosome to measure the GUS activity. The GUS activities were determined in extracts from cells grown without (−Tc) or with (+Tc) tetracycline. The GUS activity is expressed as U/mg of protein. Each value is the average of at least two experiments done with three separate clones, and the calculated standard deviations are indicated in parentheses.

