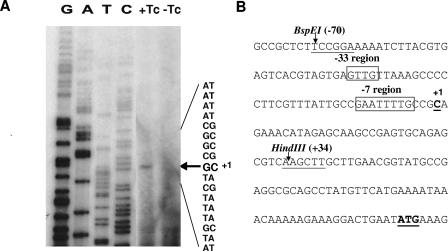
FIG. 4.
Mapping of the transcriptional start site of the orf2c operon. The results of the primer extension analysis for the PE promoter are shown in lanes +Tc and-Tc in panel A. The cells containing CTnDOT were grown overnight with (+) or without (−) tetracycline (Tc), and 40 μg of total RNA was used for the primer extension analysis. The sequencing ladder is to the left of the primer extension lanes. On the right side, the sequences of both strands of the DNA are provided. The arrow indicates the transcriptional start site. In panel B the sequence of the entire promoter region is given, from the BspEI site to the ATG start of orf2c. The −7 and −33 consensus sequence motifs identified by comparison to the consensus Bacteroides promoter sequence motifs determined by Bayley et al. (4) are boxed and labeled above the line. The bp numbers are relative to the transcriptional start site (C), which is labeled +1. The HindIII site shown to be important in the cloning of a functional promoter region is shown at bp +34.

