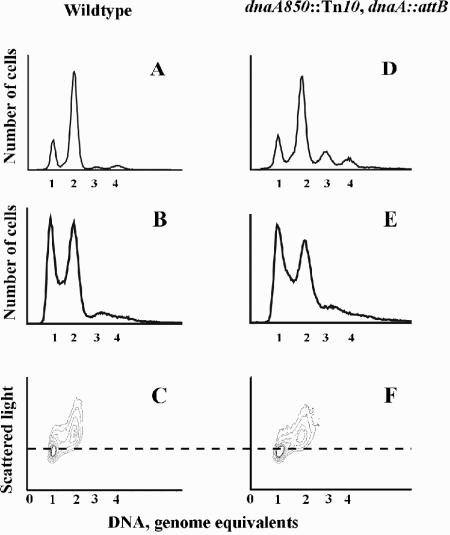
FIG. 4.
The initiation mass of slow-growing cells carrying dnaA in attB. Flow cytometry histograms of wild-type (CM735) and dnaA850::Tn10 cells carrying dnaA in attB (ALO2465) grown under steady-state conditions at 37°C in minimal medium supplemented with acetate, tryptophan, histidine, and methionine. The parameters measured were number of origins in rifampin- and cephalexin-treated cells (A and D) and DNA content of exponentially growing cells (B and E). Three-parameter contour plots of exponentially growing cells are shown in panels C and F. The isocontour lines are drawn through points with the same number of cells. Thus, the collection of almost concentric rings at the one- or two-chromosome position represents a “mountain” of cells. The dashed line represents the cell mass at which initiation takes place (8). The scale on number of cells and scattered light is arbitrary and represents a minimum of 100,000 cells in all panels.

