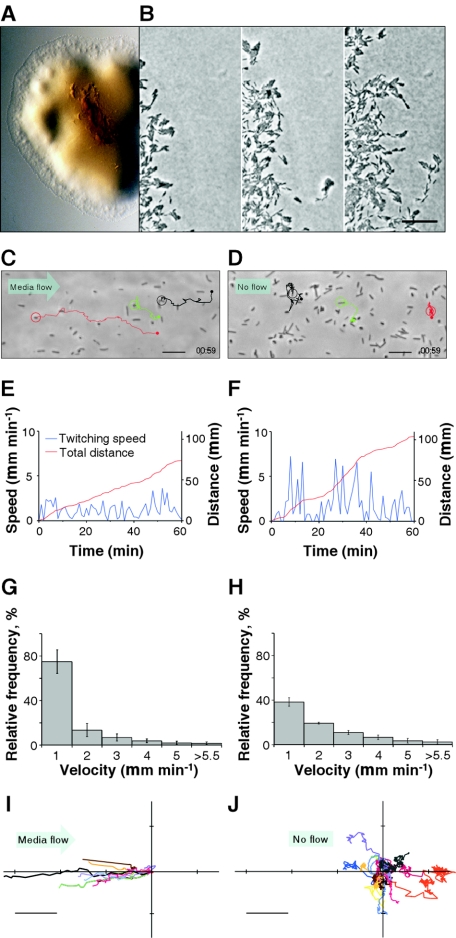
FIG. 3.
Twitching motility characteristics of wild-type X. fastidiosa. (A) Light micrograph of a colony with a peripheral fringe. (B) Sequential images (0 min, 7 h 18 min, and 14 h 20 min, left to right) depicting progressive migration of twitching cells (see movie 1A in the supplemental material; also see expanded versions and additional movies at http://www.nysaes.cornell.edu/pp/faculty/hoch/movies/). Bar, 20 μm. (C) Light micrograph depicting paths of three bacteria (circled) twitching against a flow of 20,000 μm min−1 (see movie 2 in the supplemental material and the expanded versions and additional movies at the above-cited website). Bar, 10 μm. (D) Similar depiction as in panel C, but with no flow (see movie 3 in the supplemental material and the expanded versions and additional movies at the above-cited website). Bar, 10 μm. (E and F) Twitching speed and cumulative distance traveled by the red-circled cells in panels C and D, respectively. (G and H) Histograms depicting twitching speeds for cells under flow (20,000 μm min−1) (G) and no-flow (H) conditions. Error bars represent standard errors of the mean (n = 17). (I and J) Twitching paths (starting at coordinates 0,0) measured in a 1-h period for cells under conditions of flow (20,000 μm min−1) (I) and no flow (J). Bar, 20 μm.

