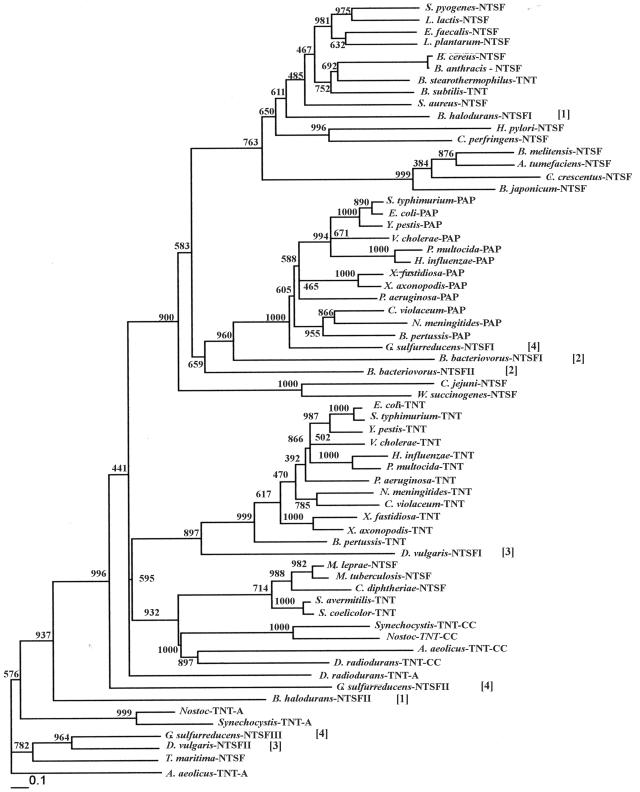
FIG. 1.
Neighbor-joining phylogenetic tree relating the proteins listed in Table 2. The tree was constructed using PHYLIP (11), as indicated in Materials and Methods. Bootstrap scores are shown at each node. The bar at the bottom of the figure represents the number of amino acid substitutions per site. The numbers in brackets identify the NTSFs from B. halodurans [1], Bdellovibrio bacteriovorus [2], D. vulgaris [3], and G. sulfurreducens [4].

