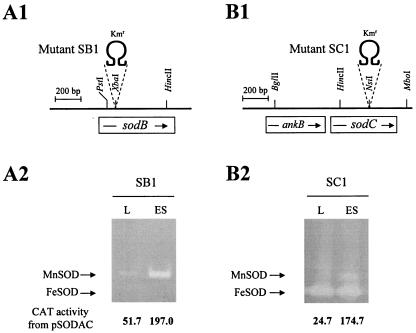
FIG. 10.
Chromosomal structures of sodB and sodC mutants and their expression of cytosolic SODs. (A1 and B1) sodB and sodC were interrupted with Ω DNA (Kmr) to generate mutants SB1 (A1) and SC1 (B1), respectively. ankB coding for an ankyrin-like protein is shown (B1). (A2 and B2) Expression of cytosolic SODs and CAT activity from sodA::cat fusion in SB1 (A2) and SC1 (B2). L and ES stand for the growth phases, as described in the Fig. 1 legend.

