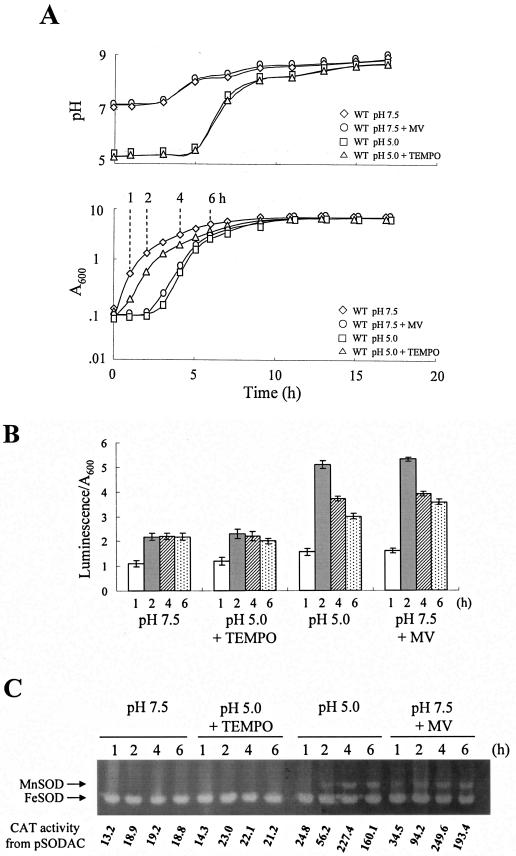
FIG. 4.
Growth, cellular superoxide level, and SOD expression of the wild type after transition to LBS adjusted to pHs 7.5 and 5.0. (A) Cell growth and pH curves of the culture broth after transition to LBS (pH 7.5) (⋄), LBS (pH 7.5) containing 3 mM MV (○), LBS (pH 5.0) (□), or LBS (pH 5.0) supplemented with 1 mM TEMPO (▵). Time points (1, 2, 4, and 6 h) to harvest cells for the assay of superoxide level and MnSOD expression are indicated. (B) Detection of cellular superoxide using lucigenin. Cells were harvested at 1 (white bar), 2 (shaded bar), 4 (hatched bar), and 6 h (dotted bar). The standard deviations of the luminescence are shown on each bar. (C) Expression of cytosolic SODs and CAT activity from sodA::cat fusion were determined with cells harvested at the time points indicated.

