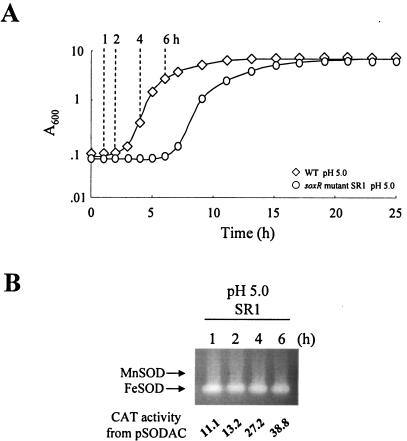
FIG. 7.
Growth and SOD expression of soxR mutant after transition to LBS (pH 5.0). (A) Cell growth of SR1 (○). The wild type (⋄) after transition to the same medium is included for comparison. Time points (1, 2, 4, and 6 h) to harvest cells for the assay of MnSOD expression are indicated. (B) Expression of cytosolic SODs and CAT activities from sodA::cat fusion in SR1 harvested at the time points indicated.

