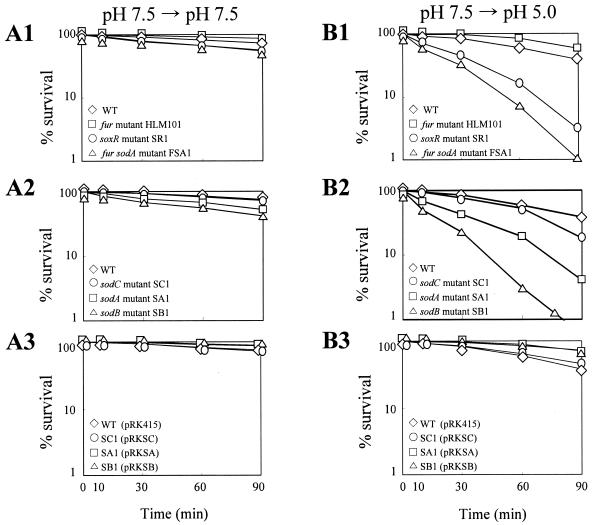
FIG. 8.
Acid tolerance of regulatory mutants affecting sodA expression, sod mutants, and sod mutants complemented with corresponding genes. Cells grown in LBS (pH 7.5) with transition to PBS (pH 7.5) (A) and SCBN (pH 5.0) (B). (A1 and B1) Regulatory mutants HLM101 (□), SR1 (○), and FSA1 (▵); (A2 and B2) sod mutants SC1 (○), SA1 (□), and SB1 (▵); (A3 and B3) sod mutants complemented with corresponding genes, SC1 containing pRKSC (○), SA1 containing pRKSA (□), and SB1 containing pRKSB (▵). The wild type (⋄) and the wild type containing pRK415 (⋄) are included as a control in each experiment. Survival was expressed as percentages of the initial numbers of CFU ml−1, which were approximately 105. Data shown are representative of triplicate experiments.

