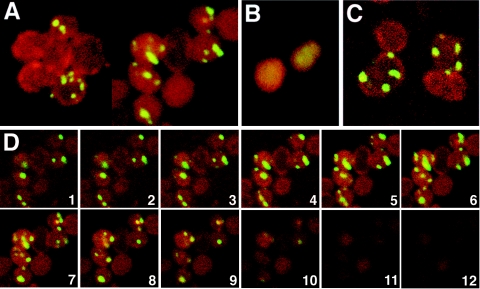
FIG. 3.
Confocal microscopic analysis of IcsA localization to multiple sites in mreB cells. Shown are fluorescence confocal microscopic images of mreB cells expressing IcsA507-620-GFP or IcsAΔ507-730-GFP (green) and stained with the membrane dye FM4-64 (red). (A) Stacks of z series images of MC1000 ΔmreB::FRT-cat-FRT cells expressing IcsA507-620-GFP, taken at 0.3-μm intervals. (B) Stacks of z series images of MC1000 ΔmreB::FRT-cat-FRT cells expressing IcsAΔ507-730-GFP, which lacks polar targeting sequences, taken at 0.3-μm intervals. (C) Single z plane image of MC1000 ΔmreB::FRT-cat-FRT cells expressing IcsA507-620-GFP. (D) Images from a single z series, taken at 0.3-μm intervals, from the lower half through to the top of a cluster of MC1000 ΔmreB::FRT-cat-FRT cells expressing IcsA507-620-GFP.

