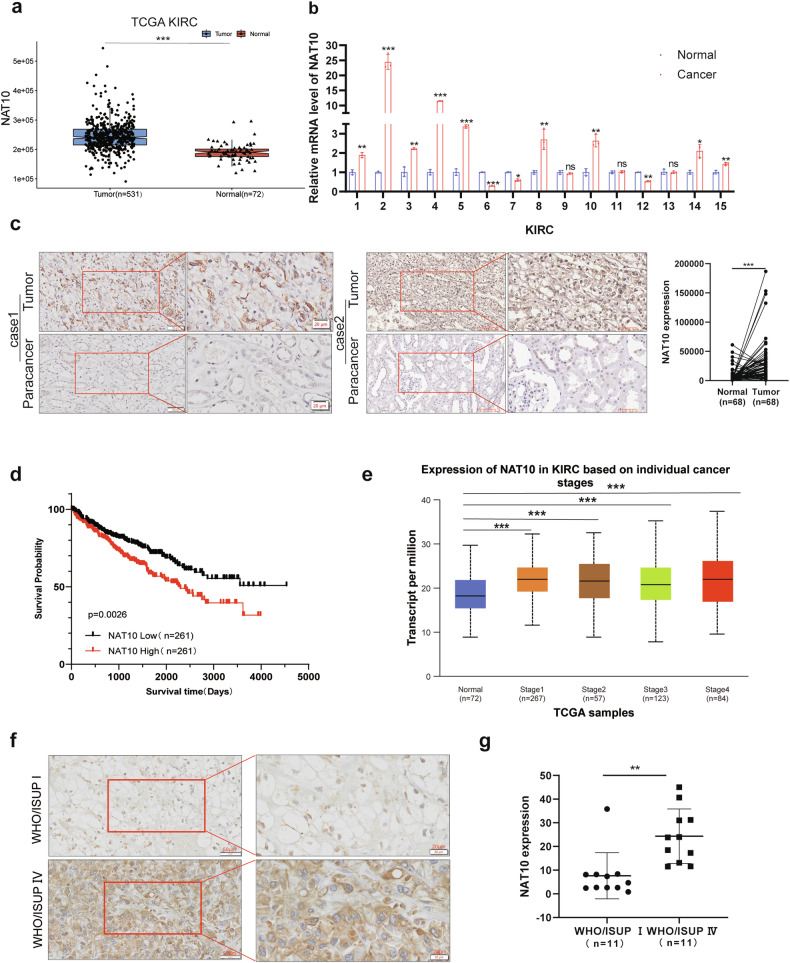
Fig. 1. Increased NAT10 expression is associated with a poor prognosis in patients with ccRCC.
a The TCGA database of Sangerbox 3.0 was used to analyze the expression levels of NAT10 in KIRC cancer tissues (n = 531) and normal tissues (n = 72). b QRT-PCR was used to detect NAT10 mRNA levels in 15 pairs of ccRCC cancer tissues and adjacent para-cancer tissues. c Left: Representative images of in situ NAT10 expression levels in 68 pairs of ccRCC cancer tissues and adjacent tissues detected by immunohistochemical staining. Scale: 50 μm (left); 20 μm (right). Statistical analysis of the intensity of immunohistochemical staining (right). d Kaplan–Meier analysis survival for ccRCC patients based on NAT10 expression (n = 261, p = 0.0026, log-rank test). e UALCAN was used to analyze the expression level of NAT10 in normal tissues and in each stage of ccRCC. f Comparison of expression levels of NAT10 in ccRCC WHO/ISUP stage I and IV by immunohistochemical staining. WHO/ISUP stage I(above), WHO/ISUP stage IV(below). Scale: 50 μm(left); 20 μm(right). g Statistical analysis of the intensity of immunohistochemical staining.

