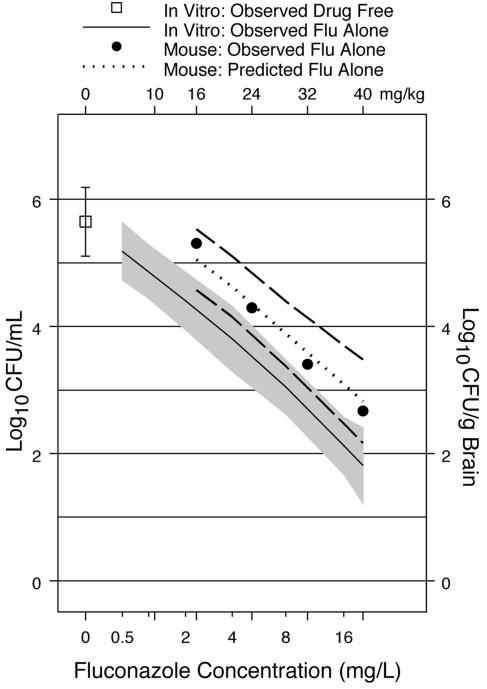
FIG. 2.
Predicted murine dose-response curve. The dotted line shows the predicted murine dose-response curve for fluconazole (Flu) alone based on the linear regression model. The broken lines show the 95% CIs for the predicted murine dose-response curve. The solid line shows the loess fit for the observed in vitro susceptibility, and the filled circles show the loess fit for the observed murine response. The shaded band shows the 99% CIs for the in vitro susceptibility. The top x axis shows the in vitro fluconazole concentrations (mg/liter). The bottom x axis shows the treatment doses of fluconazole (mg/kg/day). Murine data are from Larsen et al. (12).

