
FIGURE 2.
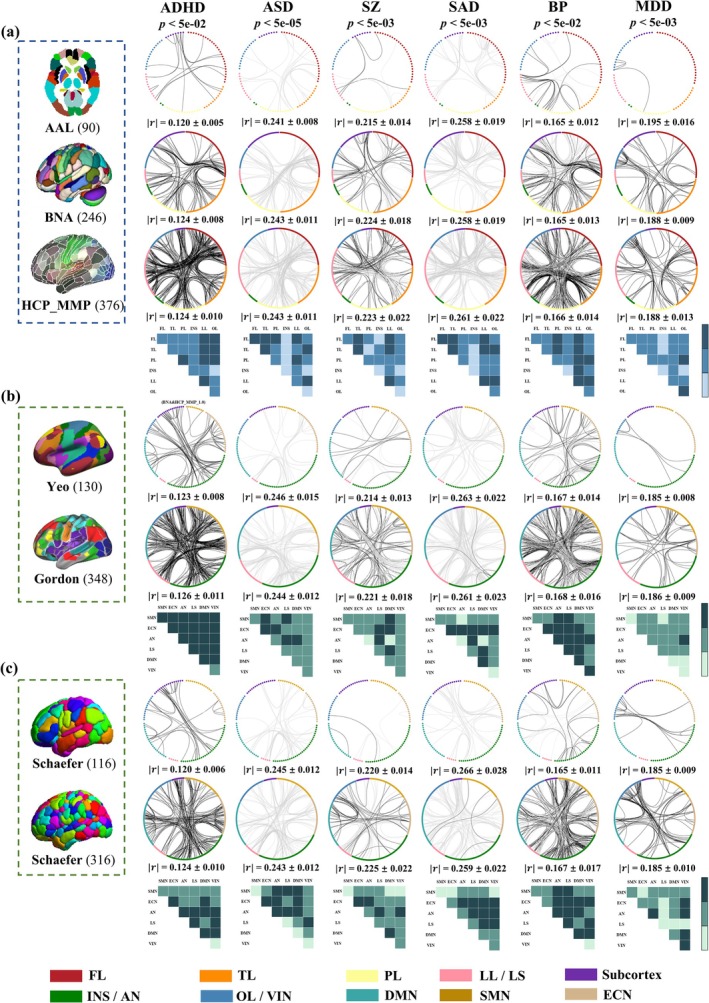
FC‐based correlations with symptom scores. Significant FCs correlated with symptoms in 3 structural atlases (a) and 2 functional atlases (b and c). Black/gray lines represent positive/negative correlations with symptom scores (FDR corrected, Supporting Information “FDR correction and permutation test”). Statistical significance that passed the FDR correction was denoted with an asterisk (*). Blue/green blocks represent replicable FCs of the structural/functional atlases. Deep‐colored blocks represent replicable FCs across all atlases, medium‐colored blocks represent across at least two atlases and light‐colored blocks represent absence of significant FCs. represents the mean of the absolute value of the correlation of significant FCs associated with symptom scores.