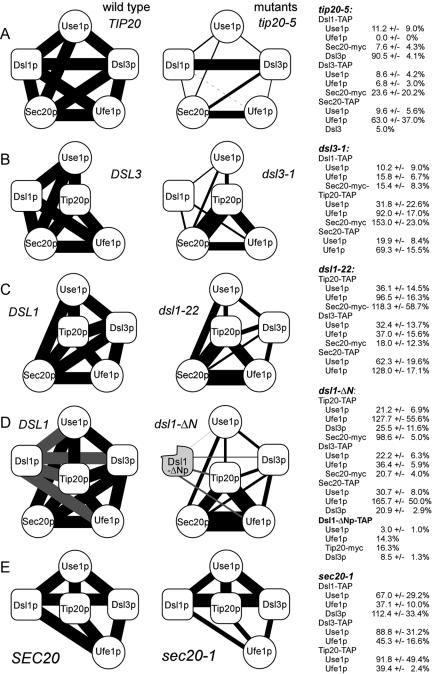
Figure 7.
Summary of the interaction data. The results if experiments like those shown in Supplementary Figures S5, S6, and S9 were quantitated using Lumi-Imager software (Roche Applied Science). The wild-type interaction was set to 100% and the level of interaction observed in mutants was expressed as average percentage ± SD. The wild-type column illustrates the coprecipitations that were actually analyzed for each wild-type/mutant combination. The results obtained with mutants are shown on the right side together with the quantification data. SNARE-proteins are shown as white spheres, and the Dsl1p complex subunits as oval boxes. (A–E) Five different pairs of wild-type and mutant alleles that were analyzed. The width of the lines connecting the symbol is proportional to the binding strength. Results obtained with TAP-tagged Dsl1-ΔN protein (D) expressed from the split dsl1-ΔCΔN-T allele are represented as gray lines.

