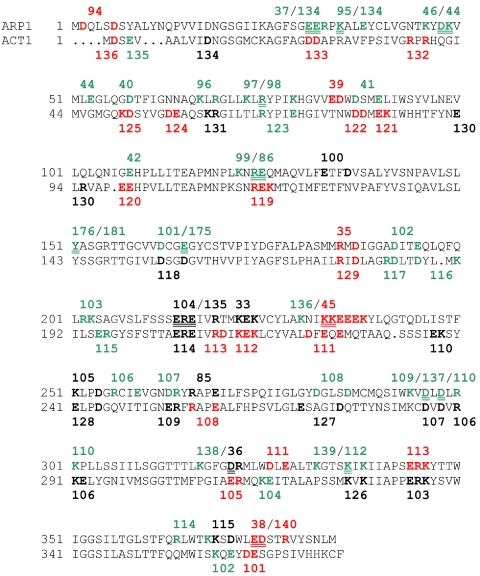
Figure 1.
Comparison of ARP1 and ACT1 charge-cluster to alanine mutations. ARP1 allele numbers are indicated. Green indicates pseudo-wild-type, red Ts–, and black lethal. Alleles separated by a slash are overlapping charge clusters where the double underline designates the shared residues. Alanine scanning alleles for actin and their phenotypes are indicated on the lower strand. Actin data are from Wertman et al. (1992).

