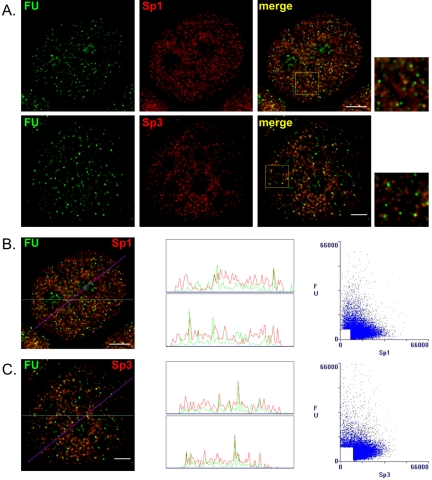
Figure 4.
Sp1 and Sp3 distribution relative to active transcription sites. MCF-7 cells were grown on coverslips in estrogen complete medium, fixed, and double labeled with anti-Sp1 or anti-Sp3 antibodies and anti-BrdU antibodies that detect nascent RNA after in situ incorporation of FU. (A) Spatial distribution was visualized by fluorescence microscopy and image deconvolution as described in Materials and Methods. Single optical sections are shown. Yellow in the merged images signifies colocalization. The boxed area in each merged image is shown enlarged. (B and C) The Sp1/FU and Sp3/FU merged images were analyzed by the generation of a horizontal linescan (top box) and a diagonal linescan (bottom box) along with a correlation scatter plot. Bar, 5 μm.

