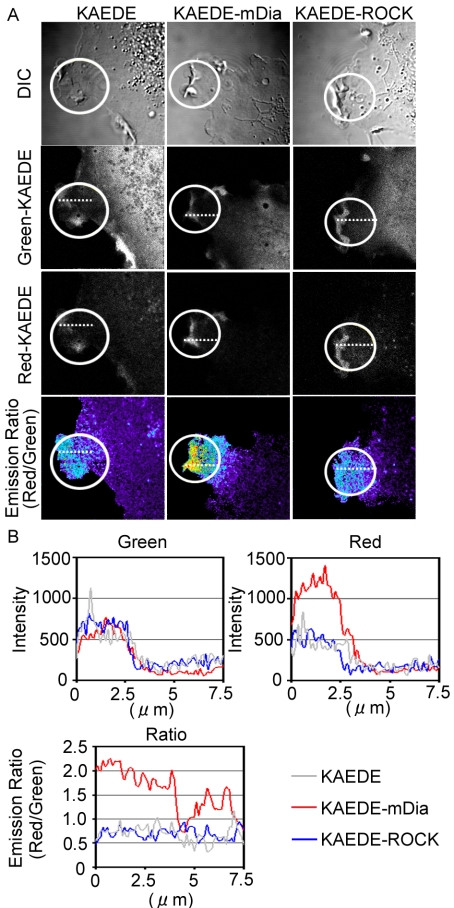
Figure 5.
Retention of mDia at the membrane ruffles. Cells expressing KAEDE, KAEDE-ROCK, or KAEDE -mDia were used for the analysis. At time point 0, KAEDE proteins in the white-circled regions were photo-converted from green to red by laser irradiation. (A) Cells were imaged for Green-KAEDE, Red-KAEDE, and DIC every 5 s. Pseudocolor Ratio images (Red-KAEDE/Green-KAEDE) were also created to demonstrate the retention of photo-converted KAEDE proteins. Representative images created after photoconversion are shown. (B) The intensities of Green-KAEDE and Red-KAEDE and Ratio values (Red/Green) along the white-dotted line are plotted against the distance from the edge of the cells.

