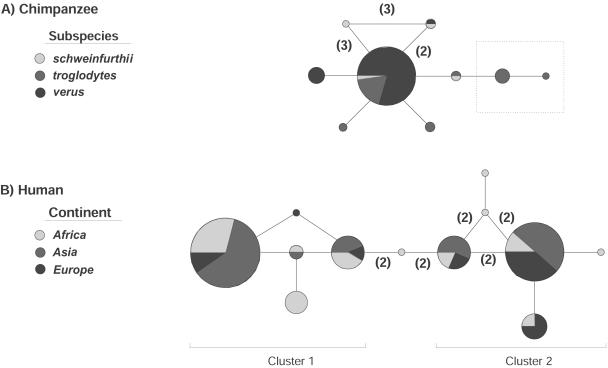
Figure 4.
MS networks of haplotypes of 5′CCR5 in chimpanzees (A) and humans (B). Each circle represents a different haplotype, and the size of each circle is proportional to the relative frequency of the haplotype. For each haplotype, the extent of shading indicates the fraction of observations in Africans, Asians, Europeans, or different subspecies of chimpanzee. The lines between haplotypes correspond to one nucleotide substitution, except where the number of nucleotides is indicated in parentheses. Reticulations indicate ambiguous relationships.

