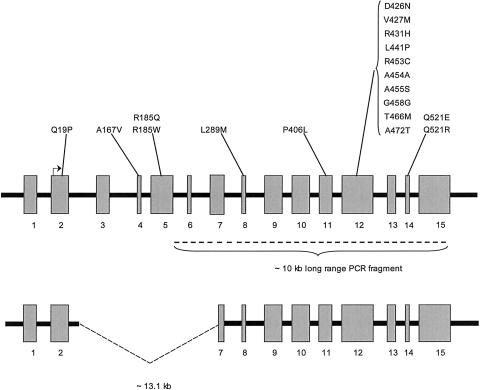
Figure 1.
Diagram of PRODH (upper panel) and ΨPRODH (lower panel). The exons, represented by the gray rectangles, are numbered and shown roughly to scale. The intronic sequence is represented by the black heavy line and is not to scale. The exonic location of the missense mutations, by exon, is shown above the rectangles. The translation start site in exon 2 is indicated by the right-angle arrow; the heavy dashed line below the rectangles in the upper panel indicates the ∼10-kb PRODH-specific PCR product. The deletion in ΨPRODH is indicated by the dashed lines in the lower panel.

