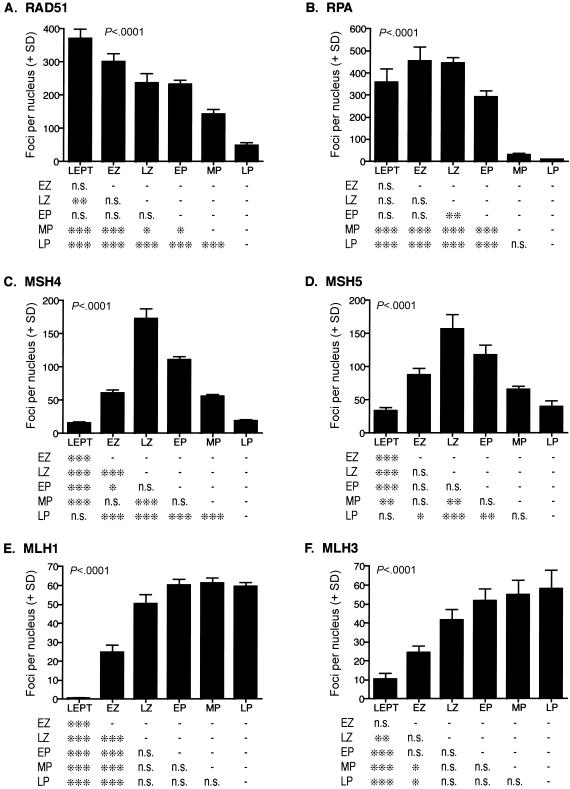
Figure 2.
Localization of DNA repair proteins during prophase I in human fetal oocytes. Graphs show quantitation (number of foci per nucleus + SD) for each substage of prophase I for RAD51 (A), RPA (B), MSH4 (C), MSH5 (D), MLH1 (E), and MLH3 (F). Examples of these localization patterns are provided in figures 3–5. LEPT = leptonema; EZ = early zygonema; LZ = late zygonema; EP = early pachynema; MP = mid-pachynema; LP = late pachynema. Data were analyzed by ANOVA after log transformation to ensure equal variances (P values are given within each bar graph; in all cases, P<.0001). Pairwise comparisons of substages were performed using the Tukey posttest and are displayed in table format below each graph. One asterisk (*) indicates P<.05, two asterisks (**) indicate P<.01, and three asterisks (***) indicate P<.001; n.s. = not significant.

