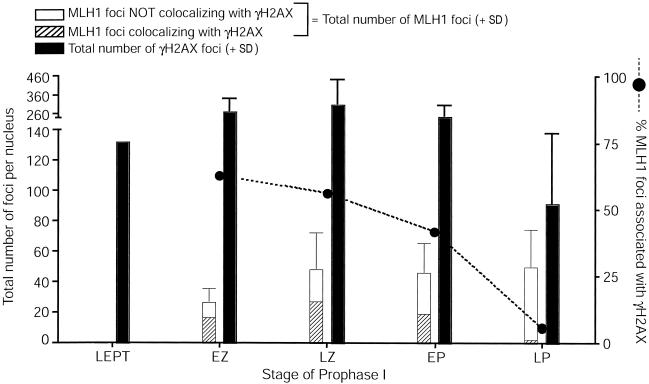
Figure 6.
MLH1 interaction with γH2AX-positive sites throughout prophase I in human fetal oocytes. Colocalization of MLH1 with sites that contain γH2AX. For each stage, total MLH1 foci are shown in the left bar, which is subdivided into those MLH1 foci that are associated with γH2AX (hatched portion of bar) and those that are independent of γH2AX (unhatched portion of bar). The error bar reflects the SD for total MLH1 focus numbers. The blackened circles and dashed line represent the total percentage of MLH1 foci that are associated with γH2AX. The total number of γH2AX foci (+ SD) is represented by the right blackened bar for each stage.

