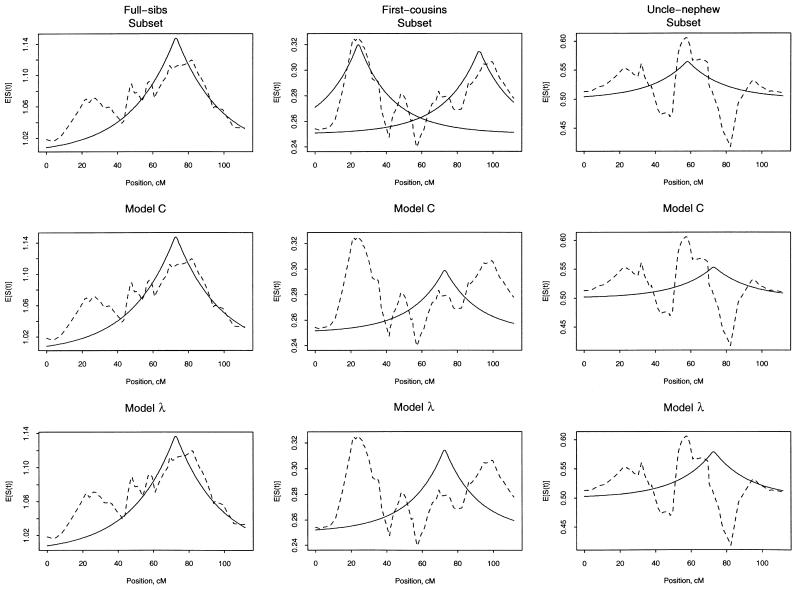
Figure 1.
Average of the estimated number of alleles shared IBD (broken line) and fitted values (solid line) for the different types of ARPs (columns) and different types of analyses (rows). Analyses correspond to those in table 4. Top row, separate τ and C were fit for each different type of ARP subset. Middle row, we used a common τ with different C coefficients for the different types of ARPs. Bottom row, the C coefficients were modeled as dependent on a single common λ, simultaneously with a single τ.

