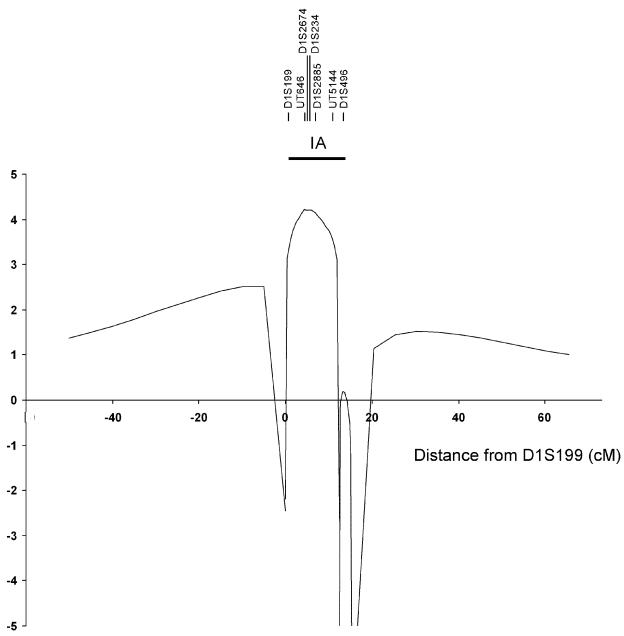
Figure 3.
Analysis of linkage with STR markers on 1p34.3-p36.13. An IA gene is localized to a 12.5-cM region between markers D1S199 and D1S496, with a maximum LOD score of 4.2. Multipoint analysis of linkage, for comparison of segregation of IA with marker loci, was performed. The location of marker loci used is indicated at the top of the diagram. The Y-axis shows LOD scores. The horizontal bar indicates the extent of the LOD-1 interval.

