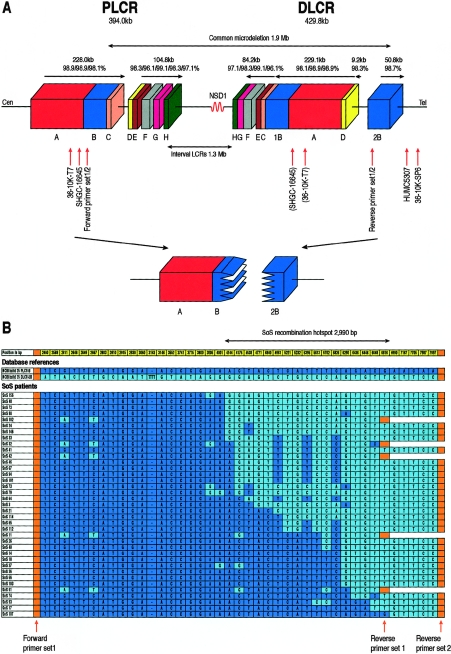
Figure 1.
A, Schematic presentation of the structure of the two LCRs flanking microdeletions in SoS. Blocks with the same color and letter represent corresponding regions with sequence homology to each other. The size of (groups of) blocks and homology percentage of each block are shown above the horizontal arrows, which indicate the genomic orientation. 36-10K-SP6 and 36-10K-T7 show the position of the BAC end sequences found in clone 36-10K. STS markers SHGC-16645 and HUMC5307 could be amplified from clone 36-10K, and “(SHGC-16645)” and “(36-10K-T7)” indicate the possible corresponding sequences located in DLCR-A. The relative position of primer sets 1 and 2 are shown. The lower part shows a deletion resulting in the formation of a junction fragment (as identified in the present study) occuring between PLCR-B and the corresponding DLCR-2B. Cen = centromere; Tel = telomere. B, PSVs found in and around the breakpoint region. Dark blue and light blue represent PSVs of PLCR-B and DLCR-2B deposited in the NCBI build 35, respectively. The position of each PSV (in bp) is numbered, starting from the forward primer of set 1. PSVs in the first ∼2.46-kb and the location of the forward primer of set 2 are not shown. The position of the forward primer of set 1 and the reverse primers of sets 1 and 2 are indicated by orange arrows and blocks. Patients with SoS are arranged in order on the basis of the location of their breakpoints. The size of the 2,990-bp hotspot is indicated with a bidirectional arrow above the figure.

