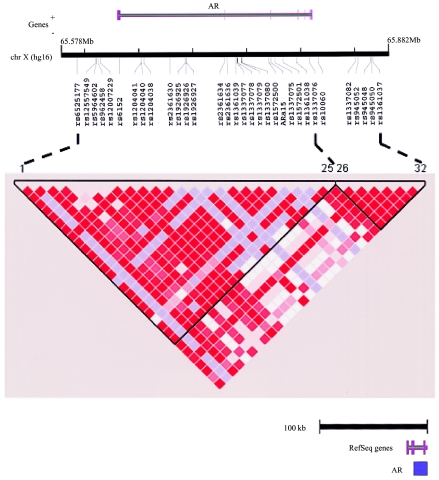
Figure 1.
SNPs and LD across the AR locus. A, Physical relationship of SNPs to the AR locus (from University of California–Santa Cruz Genome Bioinformatics build hg16); 32 working polymorphic SNPs were genotyped across the AR locus, which spanned a total of 275 kb—the SNPs covered from 56 kb upstream to 37 kb downstream of the AR gene. Using previously defined criteria (see the “Materials and Methods” section), these 32 markers describe two strong blocks of LD (188 kb and 66 kb) with gaps between adjacent blocks (bounded by the markers selected) of 11.9 kb. B, LD plot for entire population across the AR locus. Each square in the plot represents the pairwise LD relationships among all 32 markers. The two blocks (see the “Materials and Methods” section) are highlighted and are bounded by markers 1–25 and 26–32. Red denotes strong LD (as measured by D′) with a high degree of statistical confidence, pale blue denotes a high D′ with relatively low statistical confidence, and white denotes low D′.

