

Abstract
OAM detection of vortex beams using #-type lines is presented. In the far-field distribution of #-type line diffraction, the primary diffraction spots associated with the OAM of the beam can be easily distinguished because these diffraction spots contain the main beam energy (over 64%) with respect to the diffraction spots formed via small apertures; the diffraction spots formed from small apertures contain less than 1% of beam energy, which remains for the beams with a topological charge above the 7th order, and are severely disturbed by second-order diffraction spots. Therefore, #-type line OAM detection is especially applicable for measuring the vortex beams with weak intensities, such as long-distance transmitted vortex beams; these beams possess the potential to greatly impact the development of remote free-space optical communication. Moreover, the structure of the #-type lines is simple and can be adjusted according to the beam size, and the OAM detection range can reach 30.
Subject terms: Fibre optics and optical communications, Optical manipulation and tweezers, Solitons, Optics and photonics
Introduction
A vortex beam is a unique type of beam that has a ring-shaped dark hollow distribution of light intensity and a spiral-shaped phase structure. The helical phase of an axially symmetric vortex beam is expressed by the multiplier exp(ilθ) where θ is the azimuth angle in the transverse plane and the integer number l is the topological charge (TC). In 1992, Allen et al. reported that vortex beams carried orbital angular momentum (OAM)1. The TC l is the quantum number that characterizes the topological structure of the vortex beams. The OAM carried by a single photon equals to ħl, where ħ is the Planck constant. As a result, the TC l can be used to characterize the OAM of circularly symmetric vortex beams, which are the subject of our further presentation. Theoretically, the OAM range of a vortex beam is infinite; thus, it is a valuable tool for improving the rate and channel capacity of multiplexed communication2. It also has important potential applications in the field of ultra-large capacity optical communications3–6. Additionally, vortex beams have been examined for optical tweezer7–9 and super-resolution imaging applications10.
To apply vortex beams in practice, accurately and quickly detecting the OAM is important. Common methods for measuring the OAM include interferometry and diffraction. Interferometry involves (1) introducing a reference light to interfere with the vortex beam or (2) dividing the vortex beam and then allowing the reference light to interfere with the two parts of the vortex beam11–15. In 2019, Lan et al. proposed a method to measure the TC of the vortex beam based on the misaligned self-reference interferometer; this method was demonstrated via simulations and experiments with vortex beams and TCs ranging from − 1 to + 216. This method did not require strict alignment or other additional reference beams to ensure the coherence of the two beams. In addition, the device itself could be used to verify the measurement results based on the two bifurcation points in the interferogram. In 2003, a kind of diffraction technique for diagnosing phase singularities in a strip Young’s interference experiment was proposed17,18. In 2020, Tianchi Chen et al. performed a Young’s double-slit experiment with a partially coherent vortex beam (PCVB) and explored its cross-spectral density (CSD) at the focal plane after the beam was passed through a double slit19. They calculated the amplitude distributions of the CSD function of the PCVB with TCs of + 1, +2, − 2, and + 3 under various spatial coherence. The results revealed that the phase of the CSD distribution with respect to an on-axis reference point could simultaneously and quantitatively characterize the sign and magnitude of the TC carried by such a beam. Interferometry is relatively expensive and requires many optical components and complex optical path regulation. Diffraction measurement involves analyzing the far-field diffraction pattern of a vortex beam when the beam passes through a diffraction aperture. In 2009, Ghai et al. employed a slit-based approach to determine both the magnitude and sign of the topological charge of a singular beam20. In 2011, Araujo et al. used triangular holes to measure the orbital angular momentum of vortex light, with a TC measurement range of ± 721. In 2014, Silva et al. conducted comparative tests on the diffraction of vortex beams passing through square and triangular apertures and reported that when the side lengths of the square apertures and triangular apertures were equal, the measurement range of the OAM for the square aperture was more than twice that of the triangular aperture22. In 2018, Melo LA et al. directly measured the TC in elliptical beams via diffraction by a triangular aperture. Based on the simulation results, the method functioned reliably within the range of l ≤ 1023. In 2022, Jingqiu Zhuang et al. improved the vortex beam OAM detection technique based on small aperture diffraction by using soft-edged small apertures for vortex beam OAM detection24. The use of soft-edge rectangular apertures further increases the detectable range of the vortex optical TC from order 20 to order 30 with hard-edge rectangular apertures. The detection range can be increased from ± 10 order to ± 20 order by using soft-edge triangular apertures. Compared with interferometry, the diffraction method has the advantages of a simpler light path, easier diaphragm manufacturing, and lower cost; thus, it is a more widely applicable method.
For vortex beam OAM detection using diffraction apertures, the effective beam energy of the primary diffraction spots related to the OAM is low; additionally, the energy of the interfering secondary diffraction spots becomes increasingly strong with increasing TC, and the differentiation between the primary and secondary diffraction spots is unattainable when a certain TC order is exceeded. To solve this problem, in this study, a #-type line structure is proposed. in which the primary diffraction spots in the diffraction distribution have most of the beam energy and the secondary diffraction spots have little energy such that the primary diffraction spots related to the OAM can be easily distinguished. This method is especially suitable for the OAM detection of weak vortex beams, such as long-distance transmitted beams; thus, the results from this study has potential implications for the development of long-range free-space optical communications.
Theoretical analysis and experiment
The optical path for the #-type line detection method is illustrated in Fig. 1. The He-Ne laser has a wavelength of 632.8 nm and a beam waist radius of 1 mm. The beam is first expanded 8 times by lens-1 and lens-2 (with focal lengths of 50 mm and 400 mm, respectively). Then, a circular aperture is used to obtain a beam with a uniform intensity distribution, and the polarization direction is adjusted to match the polarization direction of the spatial light modulator (SLM) liquid crystal plane through a polarizer. The beam is then directed through a beam splitter and into the reflective SLM. The SLM is loaded with a forked grating pattern superimposed with a blazed grating, this creates a set of Gaussian vortex beams of different TCs in different diffraction orders when a laser beam passes through the center of the fork grating pattern. The beam splitter is used to separate and select the + 1st- or − 1st-order diffracted beam, and this beam represents the Gaussian vortex beam of the chosen TC. The signal is then directed through a circular aperture and transmitted to the #-type line for diffraction. Finally, the beam passes through Lens-3 with a focal length of 1000 mm, and the far-field diffraction distribution is collected by a charge-coupled device.
Fig. 1.

Diagram of the #-type line detection optical path.
The propagation direction of the beam is considered to be in the z direction. The optical path produces a Gaussian vortex beam, which can be represented as follows24,25:
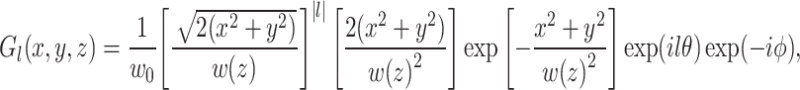 |
1 |
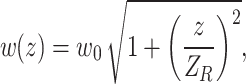
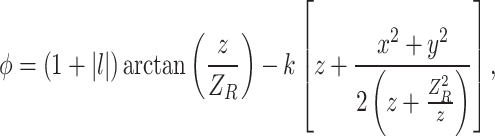
where w0 is the waist radius of the fundamental mode beam, l is the TC, and w(z) and ϕ are defined as follows:
 |
2 |
 |
3 |
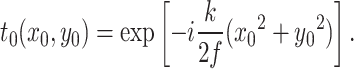
where k is the wavenumber and ZR = πω02/λ is the Rayleigh length. By substituting Eq. (1) into Fresnel’s formula, the light field distribution at the observation plane z is as follows24,26:
 |
4 |
where t(x0, y0) is the transmittance function of a diffractive aperture, t0(x0, y0) is the phase transformation factor representing Lens-3 in Fig. 1 according to lens transformation theory, and f is the focal length of Lens-327,28:
 |
5 |
The Gaussian vortex beam experiences diffraction through the #-type line, and the transmittance function of the #-type line can be expressed as follows24:
 |
6 |
where ‘a’ represents the line width of the #-type line, and ‘2b’ represents the line spacing of the #-type line.
The beam passes through the lens and creates a diffraction pattern on the focal plane. The size of this pattern is determined by the focal length of the lens. In this experiment, the maximum beam width is 8 mm, and the f-number (the ratio of the lens’s focal length to the beam’s diameter) is 125 for a focal length of 1000 mm. Gaussian vortex beams with a TC of 8 are used to analyze the diffraction patterns produced by single lines, cross lines, and #-type lines. The first row of Fig. 2 shows the structural distribution of the diffraction line, with a line width of 0.1 mm, a line distance of 0.9 mm, and a width radius w0 of 1 mm for the fundamental mode beam. The second row of Fig. 2 displays the corresponding far-field diffraction distribution. The diffraction electric field after the Gaussian vortex beam can be expressed via Eq. (7).
 |
7 |
Fig. 2.

Simulation of far-field diffraction of Gaussian vortex beams through different line structures. (a) Horizontal line; (b) vertical line; (c) double horizontal line; (d) upper right cross; (e) Lower left cross; (f) cross; and (g) #-type line.
where Ta1 is the transmittance function of the different line structures.
The resulting diffraction pattern is shown in Fig. 2. Owing to the horizontal line in Fig. 2a, diffraction forms a field distribution scattered up and down, and this distribution superimposes with the circular shape of the far field. The varying phase differences at different positions result in a bright-dark distribution on the ring. Similarly, Fig. 2b shows that the vertical line causes a light and dark distribution of the beam in the left and right directions. In Fig. 2d, the horizontal and vertical lines are simultaneously used; this results in a bright and dark distribution on the entire ring, and the number of diffraction spots is exactly twice the TC (in the case of an even TC). Figure 2f shows the diffraction pattern generated by the vortex beam when the horizontal and vertical lines pass through the center of the beam; this results in evenly distributed diffraction spots on the entire ring. The diffraction result of the Gaussian vortex beam passing through the #-type line is shown in Fig. 2g. Compared with the diffraction pattern of the cross line in Fig. 2f, the diffraction distributions of the two crosshairs contained in the #-type line overlap and interfere with each other; thus, the energy of the light spot becomes more concentrated, the size becomes smaller, and the light and dark distribution between the primary diffraction spots are more evident and subsequently easier to identify. This is the reason for using the #-type line over the simpler cross line. In the experiment, the #-type line is made of a stainless steel mask plate. To adjust the line spacing of the #-type line, laser microporous precision technology is used to make two cross mask plates with a line width of 0.1 mm, a processing accuracy of ± 0.01 mm and an aperture tolerance of ± 0.002 mm. These two cross mask plates are then combined to create the #-type line mask plate. The line spacing between the two cross mask plates is adjusted via a high-precision feeler gauge, with a deviation between 0.009 mm and − 0.002 mm and a curvature within 0.001 mm to 0.003 mm.
Figure 3 shows the diffraction results for the TCs ranging from 1 to 8, with the simulated diffraction pattern on the top and the experimental diffraction pattern on the bottom. The experimental and simulation results are consistent and confirm the feasibility of the #-type line detection vortex beam OAM method. In Fig. 3, the diffraction distribution is a series of diffraction spots in a circular pattern. As the value of the TC increases, the number of diffraction spots gradually increases, and the number of diffraction spots is always a multiple of 4. For even values of l, the number of diffraction spots is defined as follows:
 |
8 |
Fig. 3.

Simulated and experimental far-field diffraction patterns via the #-type line detection method.
For odd values of l, the diffraction pattern looks differently and is more complicated. If |l| = 1, it contains 4 bright spots shifted symmetrically from the axis in the x- and y-directions determined by the #-type lines orientation (Fig. 3, l = 1). If |l| > 1, the diffraction pattern contains:
 |
9 |
“main” bright spots and, additionally, four less intensive bright spots situated approximately on the bisector lines of the (x, y) frame (Fig. 3, l = 3). For |l| > 5, these four additional bright spots overlap with the main ones and form so called “elongated bright spots” well seen in Fig. 3, l = 7. Considering the main and additional bright spots, the total number of diffraction spots for odd l equals to:
 |
10 |
The number of diffraction spots of adjacent TCs is the same; for example, the number of diffraction spots in the diffraction patterns with TCs of 6 and 7 are both 12, but a significant difference is observed in the locations of the diffraction spots, as shown in the red dashed box in Fig. 3. Therefore, the neighboring TCs can be distinguished by the position of the spots in the diffraction pattern when the number of diffraction spots is consistent.
To make the bright spots in the diffracted pattern better visible, the diffraction pattern can be thresholded, which causes an increased difference between the intensities of separate peaks, as shown in Fig. 4 (the upper row is the simulation, and the lower row is the experimental result); this reduces the difficulty of identifying the number of diffraction spots.
Fig. 4.

Simulated and experimental far-field diffraction patterns after thresholding.
When some range in the diffraction of vortex beams with apertures is exceeded, the aperture size always needs to be adjusted to match the new beam size to maintain the evident diffraction phenomena. Figure 5 shows the simulated diffraction patterns of the vortex beams with TCs of 6 and 7 for different line widths of the #-type lines. With a TC of 6, the beam energy retained in the diffraction pattern decreases with a gradual increase in the line width, and the light intensity of the bright spot weakens, but the number of spots does not change. The same is true for a TC of 7. Under the same parameter conditions, the line spacing 2b of the used #-type lines in Fig. 3 is everywhere 0.9 mm.
Fig. 5.

Simulation results of the far-field diffraction of the Gaussian vortex beam with the TC l = 6 and 7 by #-type lines with different line widths.
To investigate the sensitivity of the new method to practical imperfectnesses, the beam axis was intentionally misaligned from the center of the “#-type” structure, and the diffraction result is illustrated in Fig. 6. With the beam center established as the coordinate origin, Δx and Δy represent the offsets of the #-type lines from this origin in the x- and y-directions, respectively. Owing to constraints in the experimental setup, the direction of the offset is limited and then Δx and Δy are always the same. For Gaussian vortex beams characterized with the TC l values of 8 and − 8, the width radius w0 of 1 mm for the fundamental mode beam, and the #-type lines featuring a line spacing of 0.9 mm and a line width of 0.1 mm, the impact of offset on diffraction is shown in Fig. 6 for offsets of 0, 0.25, 0.5, 0.75 and 1.0 mm. The diffraction patterns reveal a nonuniform distribution of bright spots, and similar outcomes are observed for beams with TC l = 8 and − 8. Notably, the arrangement of the bright spots in dense and dispersed regions is inversely related; thus, a method is provided to discern the sign of the topological charge. As illustrated in Fig. 6b–e, the diffraction pattern shows a concentration of bright spots in the lower right quadrant and a dispersion in the upper left quadrant when the TC is positive. Conversely, a negative topological charge results in the opposite distribution. As shown in Fig. 6d, a new bright spot emerges in the upper left quadrant when the offsets Δx and Δy reach 0.75 mm. Simultaneously, the bright spots in the lower right quadrant converge and become difficult to distinguish. Under the conditions above, the permissible offset is approximately 0.5 mm. The experimental observations of the bright spot dispersion and concentration effectively align with the simulation presented in Fig. 6f.
Fig. 6.

(a–e) Simulation and (f) experiment when the #-type lines shifting from the beam center.
Figure 7 displays the far-field diffraction distributions of Gaussian vortex beams with TCs of orders 10, 20 and 30 via the #-type line detection method. With increasing TC, the distance between the two lines needs to be reduced to improve the detection range of the OAM. The number of diffraction spots can no longer be recognized in Fig. 7c1 of the diffraction pattern because of the severe sticking of the diffraction spots. To improve the recognition of the diffraction spots, Fig. 7a1, b1, and c1 are thresholded to improve the contrast of the diffraction pattern. Figure 7a2–c2 are the results of the thresholding process. Figure 7a3–c3 are the local enlarged images of the white dashed part in Fig. 7a2–c2, respectively. According to the simulation results, the topological load detection range of the #-type line can reach the 30th order by adjusting the line spacing.
Fig. 7.

Simulation of the far-field diffraction of the #-type line detection methods when TC l = 10, 20 and 30.
Figure 8 shows the diffraction pattern of a Gaussian vortex beam transmitted through a #-type line, rectangular aperture, and triangular aperture. The first row displays a two-dimensional top view, whereas the second row shows a three-dimensional stereo view. The incident Gaussian vortex beam has a wavelength of 632.8 nm and a fundamental mode beam width radius of 1 mm. The lens focal length is 1000 mm, the line width is 0.1 mm, the rectangular aperture edge length is 1 mm, and the triangular aperture side length is 2 mm. The light intensity of the far-field diffraction pattern is normalized in three-dimensional coordinates. To determine the TC value of the vortex beam, the primary and secondary diffraction spots of the diffraction patterns of the rectangular and triangular apertures need to be distinguished; here the primary bright spot area is indicated by the white dotted line. However, the secondary diffraction spots not only disperse and weaken the energy of the primary diffraction spots but also interfere with the identification of the number of primary diffraction spots. Despite this interference, the majority of the energy in the diffraction distribution of the #-type line is concentrated in the primary diffraction spots.
Fig. 8.

Simulation results for far-field diffraction of the Gaussian vortex beam with the TC |l| = 8 by different apertures.
Table 1 shows the percentages of the primary diffraction spot energy and diffraction energy of the Gaussian vortex beams after diffraction through various apertures. The diffraction energy refers to the ratio of the energy of the entire far-field diffraction distribution to the energy of the incident beam, and the main bright spot energy refers to the ratio of the energy contained in the main bright spot region of the far-field diffraction distribution to the energy of the incident beam. The majority of the energy in the diffraction distribution of the rectangular and triangular apertures is blocked by the aperture; this results in a decrease in the energy of the primary diffraction spots as the TC number increases. For TC numbers exceeding 7, the energy contained in the primary diffraction spots in the diffraction distribution is less than 1%. However, the far-field energy of the diffraction of #-type lines is largely retained, and the energy of the main primary diffraction spots increase as the TC number increases. For TC numbers between 1 and 9, the primary diffraction spots retain more than 64% of the beam energy. This is caused by the absence of interference from the secondary light spots and the ability of the primary diffraction spots to retain the majority of the beam energy. Therefore, the #-type line method is more suitable for detecting relatively weak vortex beams.
Table 1.
Far-field primary spot energy of the Gaussian vortex beams after being directed through different apertures.
| Topological charges | #-type line (%) | Rectangular aperture (%) | Triangular aperture (%) |
|---|---|---|---|
| 1 | 64.32 | 89.84 | 78.05 |
| 2 | 78.89 | 50.27 | 44.63 |
| 3 | 82.06 | 21.58 | 23.12 |
| 4 | 76.48 | 9.32 | 10.84 |
| 5 | 77.08 | 3.81 | 5.34 |
| 6 | 78.91 | 1.46 | 2.67 |
| 7 | 78.96 | 0.48 | 1.25 |
| 8 | 80.15 | 0.16 | 0.57 |
| 9 | 81.18 | 0.05 | 0.24 |
Conclusion
In summary, we detect the TC of the Gaussian vortex beams via the #-type line. Our simulation results for Gaussian vortex beams with TCs ranging from 1 to 8 are consistent with our experimental results. Furthermore, our simulation can accurately measure TCs up to 30 orders. The far-field energy diffracted by the #-type line is concentrated in the primary diffraction spots; thus, they can be easily identified. For example, when a Gaussian vortex beam with a fundamental mode beam width and radius of 1 mm passes through a #-type line with a line width of 0.1 mm, the OAM of the beam can be detected even with relatively weak intensity. The flexibility of adjusting the line spacing of the #-type line also reduces the requirement for the beam width of the vortex beam. These findings have significant implications for the advancement of vortex beam applications.
Author contributions
T.W., H.W., Y.L. and H.X. completed the manuscript writing, T.W. and H.W. revised the manuscript. T.W. and H.W. prepared Figs. 1, 2, 3, 4, 5, 6 and 7 and Y.L. prepared Table 1, and all authors reviewed the manuscript.
Funding
Jiangsu Key Disciplines of the Fourteenth Five-Year Plan (2021135).
Data availability
The datasets generated during and/or analysed during the current study are available from the corresponding author on reasonable request.
Declarations
Competing interests
The authors declare no competing interests.
Footnotes
Publisher’s note
Springer Nature remains neutral with regard to jurisdictional claims in published maps and institutional affiliations.
References
- 1.Allen, L., Beijersbergen, M. W., Spreeuw, R. J. & Woerdman, J. P. Orbital angular momentum of light and the transformation of Laguerre-Gaussian laser modes. Phys. Rev. A. 45(11), 8185–8189 (1992). [DOI] [PubMed] [Google Scholar]
- 2.Bauer, T. et al. Optics. Observation of optical polarization möbius strips. Science347(6225), 964–966 (2015). [DOI] [PubMed] [Google Scholar]
- 3.Liu, J. et al. Amplifying orbital angular momentum modes in ring-core erbium-doped fiber. Research 7623751 (2020). [DOI] [PMC free article] [PubMed]
- 4.Liu, J. et al. 1-Pbps orbital angular momentum fibre-optic transmission. Light Sci. Appl.11(1), 202 (2022). [DOI] [PMC free article] [PubMed] [Google Scholar]
- 5.Liu, Z. et al. Data transmission under high scattering based on OAM-basis transmission matrix. Opt. Lett.47(17), 4580–4583 (2022). [DOI] [PubMed] [Google Scholar]
- 6.Kong, A. et al. Extending orbital angular momentum multiplexing to radially high orders for massive mode channels in fiber transmission. Opt. Lett.48(14), 3717–3720 (2023). [DOI] [PubMed] [Google Scholar]
- 7.Lamperska, W., Masajada, J., Drobczyński, S. & Wasylczyk, P. Optical vortex torque measured with optically trapped microbarbells. Appl. Opt.59(15), 4703–4707 (2020). [DOI] [PubMed] [Google Scholar]
- 8.Stuhlmüller, N. C. X., Fischer, T. M. & Las Heras, D. Colloidal transport in twisted lattices of optical tweezers. Phys. Rev. E106, 034601 (2022). [DOI] [PubMed]
- 9.Zeng, K. et al. Gradient torque and its effect on rotational dynamics of optically trapped non-spherical particles in the elliptic Gaussian beam. Opt. Express31(10), 16582–16592 (2023). [DOI] [PubMed] [Google Scholar]
- 10.Wang, J., Li, F. & Kang, G. Multiwavelength achromatic super-resolution focusing via a metasurface-empowered controlled generation of focused cylindrically polarized vortex beams. Opt. Express. 30(17), 30811–30821 (2022). [DOI] [PubMed] [Google Scholar]
- 11.Xu, H. F., Zhang, R., Sheng, Z. Q. & Qu, J. Focus shaping of partially coherent radially polarized vortex beam with tunable topological charge. Opt. Express. 27(17), 23959–23969 (2019). [DOI] [PubMed] [Google Scholar]
- 12.Kumar, P. & Nishchal, N. K. Modified Mach-Zehnder interferometer for determining the high-order topological charge of Laguerre-Gaussian vortex beams. J. Opt. Soc. Am. A. 36(8), 1447–1455 (2019). [DOI] [PubMed] [Google Scholar]
- 13.Ma, J. et al. Characteristics of fork-shaped fringes formed by off-axis interference of two vortex beams. J. Opt. Soc. Am. A. 38(1), 115–123 (2021). [DOI] [PubMed] [Google Scholar]
- 14.Cox, M. A. et al. Interferometric orbital angular momentum mode detection in turbulence with deep learning. Appl. Opt.61(7), D1–D6 (2022). [DOI] [PubMed] [Google Scholar]
- 15.Qin, H. et al. Highly accurate OAM mode detection network for ring airy Gaussian vortex beams disturbed by atmospheric turbulence based on interferometry. J. Opt. Soc. Am. A. 40(7), 1319–1326 (2023). [DOI] [PubMed] [Google Scholar]
- 16.Lan, B. et al. The topological charge measurement of the vortex beam based on dislocation self-reference interferometry. Phys. Scr.94(5), 055502 (2019). [Google Scholar]
- 17.Bogatiryova, H. V., Felde, C. V., & Polyanskii. P. V. Referenceless testing of vortex optical beams. Opt. Appl.33, 695–708 (2003).
- 18.Felde, C. V. Diffraction diagnostics of phase singularities in optical fields. Proc. SPIE5477, 67–76 (2004).
- 19.Chen, T. et al. Young’s double-slit experiment with a partially coherent vortex beam. Opt. Express28 (25), 38106–38114 (2020). [DOI] [PubMed] [Google Scholar]
- 20.Ghai, D. P., Senthilkumaran, P. & Sirohi, R. S. Single-slit diffraction of an optical beam with phase singularity. Opt. Lasers Eng.47, 123–126 (2009). [Google Scholar]
- 21.De Araujo, L. E. E. & Anderson, M. E. Measuring vortex charge with a triangular aperture. Opt. Lett.36 (6), 787–789 (2011). [DOI] [PubMed] [Google Scholar]
- 22.Silva, J. G. et al. Unveiling square and triangular optical lattices: A comparative study. Opt. Lett.39(4), 949–952 (2014). [DOI] [PubMed] [Google Scholar]
- 23.Melo, L. A. et al. Direct measurement of the topological charge in elliptical beams using diffraction by a triangular aperture. Sci. Rep.8(1), 6370 (2018). [DOI] [PMC free article] [PubMed] [Google Scholar]
- 24.Zhuang, J. Q. et al. Orbital angular momentum detection of vortex beam based on soft-edge aperture. Opt. Precis Eng.30(12), 1394–1405 (2022). [Google Scholar]
- 25.Chen, J., Ke, X. Z. & Yang, Y. M. Laguerre-Gaussian beam diffraction and dispersion of the orbital angular momentum. Acta Opt. Sin. 34(04), 0427001 (2014). [Google Scholar]
- 26.Born, M. & Wolf, E. Principles of Optics: Electromagnetic Theory of Propagation, Interference and Diffraction of Light 7th Edn (Cambridge University Press, 1999).
- 27.Wang, S. F. Information Optics Theory and Applications 3rd Edn (Science Press, 2009).
- 28.Goodman, J. W. Introduction to Fourier Optics 2nd Edn (McGraw-Hill, 1996).
Associated Data
This section collects any data citations, data availability statements, or supplementary materials included in this article.
Data Availability Statement
The datasets generated during and/or analysed during the current study are available from the corresponding author on reasonable request.