

ABSTRACT
Colorectal cancer (CRC) is well characterized in terms of genetic mutations and the mechanisms by which they contribute to carcinogenesis. Mutations in APC, TP53, and KRAS are common in CRC, indicating key roles for these genes in tumor development and progression. However, for certain tumors with low frequencies of these mutations that are defined by tumor location and molecular phenotypes, a carcinogenic mechanism dependent on BRAF mutations has been proposed. We here analyzed targeted sequence data linked to clinical information for CRC, focusing on tumors with a high tumor mutation burden (TMB) in order to identify the characteristics of associated mutations, their relations to clinical features, and the mechanisms of carcinogenesis in tumors lacking the major driver oncogenes. Analysis of overall mutation frequencies confirmed that APC, TP53, and KRAS mutations were the most prevalent in our cohort. Compared with other tumors, TMB‐high tumors were more frequent on the right side of the colon, had lower KRAS and higher BRAF mutation frequencies as well as a higher microsatellite instability (MSI) score, and showed a greater contribution of a mutational signature associated with MSI. Ranking of variant allele frequencies to identify genes that play a role early in carcinogenesis suggested that mutations in genes related to the DNA damage response (such as ATM and POLE) and to MSI (such as MSH2 and MSH6) may precede BRAF mutations associated with activation of the serrated pathway in TMB‐high tumors. Our results thus indicate that TMB‐high tumors suggest that mutations of genes related to mismatch repair and the DNA damage response may contribute to activation of the serrated pathway in CRC.
Keywords: colorectal cancer, CpG island methylator phenotype (CIMP), molecular phenotype, precision medicine, tumor mutation burden (TMB)
Colorectal cancer (CRC) tumors with high tumor mutation burden (TMB) often exhibit distinct molecular features, including lower KRAS and higher BRAF mutation frequencies, microsatellite instability (MSI), and a mutational signature linked to the CpG island methylator phenotype (CIMP). Analysis suggests that mutations in mismatch repair and DNA damage response genes may precede BRAF mutations, contributing to serrated pathway activation in these tumors.

Abbreviations
- CIMP
CpG island methylator phenotype
- CNA
copy number alteration
- CV
coefficient of variation
- DDR
DNA damage response
- FFPE
formalin‐fixed paraffin‐embedded
- MMR
mismatch repair
- MSI
microsatellite instability
- NMF
nonnegative matrix factorization
- PI3K
phosphatidylinositol 3‐kinase
- RPM
reads per million
- RTK
receptor tyrosine kinase
- TMB
tumor mutation burden
- VAF
variant allele frequency
1. Introduction
Colorectal cancer is a well‐characterized malignancy with regard to associated genetic mutations and the mechanisms underlying their contributions to carcinogenesis. On the basis of the frequency of chromosomal abnormalities, a model of colorectal carcinogenesis has been proposed in which normal epithelial cells transition to adenoma and then to carcinoma as a result of the stepwise acquisition of genetic mutations [1]. Mutations in APC, TP53, and KRAS genes have been found to play key roles in colorectal cancer development [2]. Indeed, high frequencies of mutations in APC, TP53, KRAS, and PIK3CA have been detected in many colorectal cancer cohorts, including The Cancer Genome Atlas (TCGA) [3, 4, 5, 6], establishing these mutations as broadly relevant to colorectal carcinogenesis, regardless of genetic background. However, the frequencies of such mutations differ according to tumor location. For instance, APC and TP53 mutations are more frequent in left‐sided colon cancer, whereas KRAS mutations are more frequent in right‐sided colon cancer [7]. Such differences suggest that stepwise mutations of APC, TP53, KRAS, and PIK3CA do not fully explain the mechanisms of colorectal carcinogenesis.
In addition to mutation frequencies, right‐sided and left‐sided colon tumors differ according to adenoma type [8], morphology [9], immune cell infiltration and response to immunogens [10, 11], metastasis sites [12], age and sex association [11], prognosis at various stages [13], and the effects of treatment including the efficacy of antibodies to EGFR and postoperative chemotherapy [14]. These clinical and treatment response differences suggest that the mechanisms of cancer development also differ in a manner dependent on tumor location.
Classification of colorectal cancer has advanced not only with regard to these site‐specific characteristics [15] but also at the molecular level, including features such as microsatellite instability (MSI) and CpG island methylator phenotype (CIMP) [16, 17, 18, 19, 20]. Measurement of CpG island methylation at eight sites allowed the definition of three classes of colorectal cancer based on the number of methylated sites, with these classes being found to differ with regard to 5‐year survival rate [21]. In another study, the combination of CIMP status (based on five methylation sites), KRAS and BRAF mutations, and MSI status defined five subtypes of colorectal cancer that also differed in survival outcome [22]. CIMP positivity is associated with BRAF mutations and leads to epigenomic abnormalities as a result of the methylation of mismatch repair (MMR) genes, a mechanism of carcinogenesis known as the serrated pathway [23]. However, the mechanism by which BRAF mutations give rise to such hypermethylation is not fully understood.
In the present study, we focused on cases of colorectal cancer with a high tumor mutation burden (TMB). Clinicians in our team observed in real‐world clinical settings that TMB‐high, defined as ≥ 10 mutations/Mb (including both synonymous and nonsynonymous substitutions), often fails to predict a favorable response to immune checkpoint inhibitors (ICIs). To address this, we redefined TMB‐high based solely on nonsynonymous substitutions and analyzed targeted sequence data linked to clinical information in order to identify characteristics of these mutations and their clinical implications. Examination of overall and individual mutation frequencies in TMB‐high cases confirmed similarities between our cohort and previously reported data. On the basis of variant allele frequency (VAF) of individual mutations, we attempted to identify early mutations in the carcinogenesis of TMB‐high and MSI cases. Despite the limited number of loci for the targeted sequencing, we also analyzed single‐nucleotide substitution patterns to elucidate etiology.
2. Materials and Methods
2.1. Clinical Samples
From April 2021 to August 2022, Fujita Health University Hospital conducted a gene panel test free of charge as an in‐house research study on 1000 cases of solid cancer. Of the 404 cases of colorectal cancer patients who were diagnosed and underwent surgery during this period as part of their regular treatment, 150 cases who were given an explanation of this study and consented to participate in the study were included in this analysis. Postoperative pathological tissue samples were obtained from 150 individuals with primary colorectal cancer who underwent colectomy at Fujita Health University Hospital between 16 April 2021 and 22 August 2022. Cases of hereditary colorectal cancer and colitic cancer were excluded. The research protocol was approved by the Ethics Committee of Fujita Health University Hospital (approval no. HM21‐172), and written informed consent was obtained from all patients regardless of disease stage classification or treatment history. Clinical and pathological classification was performed according to the 9th edition of the Japanese Classification of Colorectal Carcinoma.
2.2. Targeted Exome Sequencing
Genomic testing was performed in‐house using the PleSSision‐Rapid‐Neo testing platform as described in previous studies [24]. Briefly, the hematoxylin and eosin‐stained slides were marked by pathologists, and genomic DNA was extracted from 10‐μm‐thick formalin‐fixed paraffin‐embedded (FFPE) tissue sections of microdissected tumor‐rich areas with the use of a Maxwell RSC FFPE Plus DNA Kit (AS1720) for capture probe sequencing. The quantity and quality of DNA were assessed with a 4200 TapeStation System (Agilent Technologies) and high quality DNA, defined as having a DNA integrity number (DIN) ≥ 2.0, was used for the sequencing library preparation. The DNA (10–100 ng) was processed for preparation of a targeted sequencing library with SureSelectXT Low Input Target Enrihment with Pre‐Capture Pooling (Agilent Technologies). Briefly, DNA extracted from FFPE tissues was enzymatically fragmented using the SureSelect Enzymatic Fragmentation Kit and SureSelect custom design panel (Agilent Technologies). Target regions of all 145 genes were specifically enriched using oligonucleotide probes. The overhung DNA fragments were then end‐repaired, adenylated, ligated to index/sequencing adapters, enriched by PCR, and purified according to the manufacturer's instructions. The quality and quantity of the purified pre‐capture library were evaluated using an Agilent 4200 TapeStation with D1000 ScreenTape (Agilent Technologies). Hybridization capture and library purification were performed according to the manufacturer's instructions. The captured library pools were enriched by PCR and purified and quantified using an Agilent 4200 TapeStation with High Sensitivity D1000 ScreenTape (Agilent Technologies). The enriched libraries were sequenced with a NextSeq 2000 instrument (Illumina), generating 150‐bp paired‐end reads.
2.3. Sequencing Read Analysis
The obtained sequence data were analyzed with the GenomeJack pipeline of Mitsubishi Electric Software Corporation (http://genomejack.net) for mapping to the reference genome and variant calling. Mutation annotations were performed on the basis of information from the COSMIC (https://cancer.sanger.ac.uk/cosmic), ClinVar (https://www.ncbi.nlm.nih.gov/clinvar), CIViC (https://civicdb.org/home), SnpEff (https://pcingola.github.io/SnpEff), and Clinical Knowledgebase (CKB: https://ckb.jax.org) databases. TMB and copy number alteration (CNA) were calculated from the resulting data. In the case of CNA, for determination of the baseline data used for count correction per amplicon, the number of reads sequenced in each of the 145‐panel amplicon probe design domains was counted so as to calculate the reads per million (RPM) value (the number of reads per one million sequence reads). The coefficient of variation (CV), mean, and median values for RPM of each amplicon in at least 100 FFPE samples were then determined, and the RPM median of the amplicons with a CV of < 0.32 and mean of > 10 was set as the baseline. The number of reads sequenced for each of the 145‐panel amplicon probe design domains was counted to calculate the copy number and to determine the RPM value for each sample. The log2 (sample RPM median/baseline RPM median) value was determined for amplicons that satisfied the conditions of CV < 0.32 and mean > 10, and the overall standard deviation (SD) and median value of this log2 ratio for each gene were calculated. Genes with a log2 ratio median value exceeding the SD or exceeding 2SD were categorized as amplification‐like and amplification, respectively. In addition, genes with a log2 ratio median value below −SD or below −2SD were categorized as loss‐like and loss, respectively. As a control, 50 genomic DNA samples were applied to normalize the read depth per amplicon. Only amplicons with a CV of the read depth of ≤ 1.5 were used. CNA was calculated for genes that had more than six amplicons, and it was measured as the median value of each amplicon per gene. TMB was standardized relative to the number of nonsynonymous somatic mutations per million bases within the target sequence. TMB‐high was defined as ≥ 20 mutations per megabase. MSI was scored with the use of the MSIsensor program [25, 26] included with the testing panel, with scores of ≥ 0.2 defined as MSI‐high.
2.4. Mutation Analysis
Variant call files were converted to mutation annotation files with the use of vcf2maf [27] and were analyzed with R version 4.3.1 [28]. Common variants predicted by GenomeJack were excluded. Analysis of the distribution and visualization of gene mutation types and clinical information were performed with maftools [29]. The relations between gene mutations and clinical information were analyzed with two‐dimensional cross‐tables and the Fisher exact test for independence. To investigate the association between TMB status and mutations, while accounting for the potential confounding effects of nonsynonymous TMB values, logistic regression models were constructed using the glm function in R. For each gene, mutation status was set as the dependent variable, with TMB and nonsynonymous TMB values included as covariates. The binomial family was specified to accommodate the binary nature of mutation status. Results for genes with a p value < 0.1 were summarized in a table, which includes coefficients, confidence intervals (CI), p values, and variance inflation factors (VIF) calculated to assess multicollinearity between TMB, and nonsynonymous TMB values. Analysis of VAF was conducted to identify early mutations associated with carcinogenesis. Variants with a higher VAF than the tumor purity and those tagged as MODIFIER by SnpEff were excluded. Each sample was ranked on the basis of VAF values. For analysis of mutational signatures involved in carcinogenesis, synonymous and nonsynonymous single‐nucleotide variants were used to aggregate 96 types of base substitutions taking into consideration the 2 bases before and after each mutation. Nonnegative matrix factorization (NMF) was performed on the aggregated matrix with the use of NMF package [30], with determination of the number of components constituting base substitution patterns from the cophenetic correlation coefficient. Mutational signatures were determined with MutationalPatterns [31], referencing the COSMIC database (https://cancer.sanger.ac.uk/signatures/sbs), and the contribution rate of each signature for each sample was calculated. For visualization of signature contributions and VAF rankings, pheatmap [32] was adopted, and clustering was performed with the Euclidean distance matrix and complete linkage method to generate a heat map.
3. Results
The characteristics of the patient cohort (91 males and 59 females) are shown in Table 1. Three patients had two primary tumor sites, which resulted in 93 samples from 91 males and 60 samples from 59 females being analyzed for mutations. The age of the patients ranged from 36 to 93 years, with a median of 71 years. Ten tumors were located in the cecum, 27 in the ascending colon, 18 in the transverse colon, 12 in the descending colon, 29 in the sigmoid colon, and 57 in the rectum. With regard to pathological TNM classification, 2, 31, 39, 60, and 21 tumors were classified as stage 0, stage I, stage IIa‐c, stage IIIa‐c, and stage IVa‐c, respectively.
TABLE 1.
Characteristics of the study samples (n = 153).
| Charastaristic | No. (%) |
|---|---|
| Sex | |
| Female | 60 (39%) |
| Male | 93 (61%) |
| Age (years) | 71 (36–93) |
| Tumor location | |
| ICC | 10 (6.5%) |
| ACC | 27 (18%) |
| TCC | 18 (12%) |
| DCC | 12 (7.8%) |
| SCC | 29 (19%) |
| RC | 57 (37%) |
| pStage | |
| 0 | 2 (1.3%) |
| I | 31 (20%) |
| IIa‐c | 39 (25%) |
| IIIa‐c | 60 (39%) |
| IVa‐c | 21 (14%) |
Note: Data are presented as number (%), with the exception of age, which is shown as the median (range).
Abbreviations: ACC, ascending colon cancer; DCC, descending colon cancer; ICC, ileocolic cancer; RC, rectal cancer; SCC, sigmoid colon cancer; TCC, transverse colon cancer.
To assess the types and frequencies of gene mutations and their relations to TMB, MSI, and tumor site, we generated an oncoplot (Figure 1). The top three most frequently mutated genes were APC, TP53, and KRAS, with mutation frequencies of 89%, 84%, and 42%, respectively. Various types and positions of mutations were apparent within the APC sequence, whereas missense mutations were predominant for TP53 and KRAS. Among the 153 tumor samples, 14 were classified as TMB‐high, with these tumors manifesting fewer copy number variations (Figure 1, top bar plots). TMB‐high tumors were significantly associated with the right colon, with 12 out of the 14 samples originating from this region (Table 2). In addition, TMB‐high tumors showed a higher age distribution compared with TMB‐low tumors (Table 2). TMB‐high status was also often concomitant with MSI‐high status (Figure 1), and it was significantly associated with mutations in MSH6, MLH1, PMS2, and MMR pathway genes with the exception of MSH2 (Table 2).
FIGURE 1.
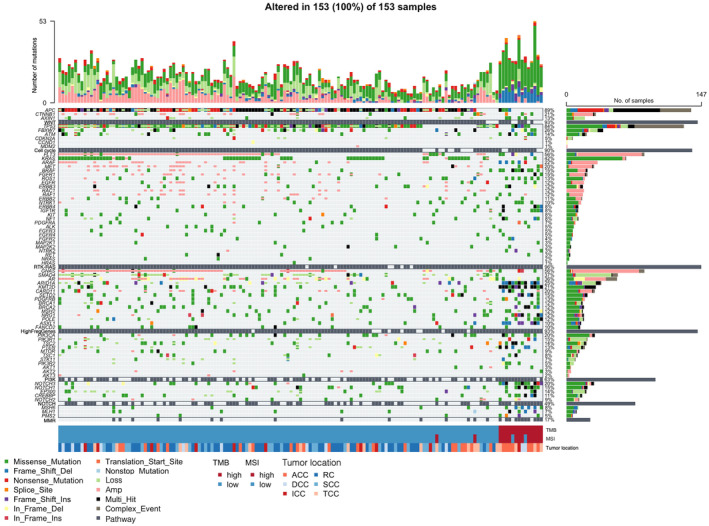
Oncoplot of somatic mutations and CNAs for genes related to the cell cycle or WNT, RTK‐RAS, PI3K, NOTCH, or MMR pathways as well as for frequently mutated genes (HighFreqGenes) in 153 tumor samples. Each cell of the plot is color coded according to the type of mutation. The stacked bar plots above and to the right show the frequency of mutation types for each sample and gene, respectively. In addition, TMB, MSI, and tumor location data are shown for each sample at the bottom. ACC, ascending colon cancer; DCC, descending colon cancer; ICC, ileocolic cancer; RC, rectal cancer; SCC, sigmoid colon cancer; TCC, transverse colon cancer.
TABLE 2.
Comparison of tumor location, age, MMR‐related gene mutation status, and mutations in cancer‐related pathways between the 14 TMB‐high samples and 139 TMB‐low samples.
| Charasteritic | TMB‐low (n = 139) | TMB‐high (n = 14) | p |
|---|---|---|---|
| Tumor location | < 0.001 | ||
| ICC | 9 (6.5%) | 1 (7.1%) | |
| ACC | 20 (14%) | 7 (50%) | |
| TCC | 14 (10%) | 4 (29%) | |
| DCC | 10 (7.2%) | 2 (14%) | |
| SCC | 29 (21%) | 0 (0%) | |
| RC | 57 (41%) | 0 (0%) | |
| Age (years) | 70 (61–76) | 77 (74–82) | < 0.001 |
| MSH2 | 0.2 | ||
| Absence | 125 (90%) | 11 (79%) | |
| Presence | 14 (10%) | 3 (21%) | |
| MSH6 | < 0.001 | ||
| Absence | 133 (96%) | 8 (57%) | |
| Presence | 6 (4.3%) | 6 (43%) | |
| MLH1 | 0.01 | ||
| Absence | 132 (95%) | 10 (71%) | |
| Presence | 7 (5.0%) | 4 (29%) | |
| PMS2 | 0.001 | ||
| Absence | 136 (98%) | 10 (71%) | |
| Presence | 3 (2.2%) | 4 (29%) | |
| WNT pathway | < 0.001 | ||
| Absence | 10 (7.2%) | 6 (43%) | |
| Presence | 129 (93%) | 8 (57%) | |
| Cell cycle pathway | 0.12 | ||
| Absence | 18 (13%) | 4 (29%) | |
| Presence | 121 (87%) | 10 (71%) | |
| RTK‐RAS pathway | 0.13 | ||
| Absence | 23 (17%) | 0 (0%) | |
| Presence | 116 (83%) | 14 (100%) | |
| PI3K pathway | < 0.001 | ||
| Absence | 82 (59%) | 1 (7.1%) | |
| Presence | 57 (41%) | 13 (93%) | |
| NOTCH pathway | < 0.001 | ||
| Absence | 95 (68%) | 1 (7.1%) | |
| Presence | 44 (32%) | 13 (93%) | |
| MRR pathway | < 0.001 | ||
| Absence | 124 (89%) | 3 (21%) | |
| Presence | 15 (11%) | 11 (79%) | |
| RTK‐RAS pathway without KRAS | 0.002 | ||
| Absence | 54 (39%) | 0 (0%) | |
| Presence | 85 (61%) | 14 (100%) |
Note: Data are presented as number (%), with the exception of age, which is shown as the median (interquartile range). Mutation status for cancer‐related pathways is shown as presence if any gene in the pathway has a mutation and absence if none of the genes in the pathway has a mutation. The p values were determined with Fisher's exact test for tumor location, the Wilcoxon rank‐sum test for age, and the chi‐square test for mutation analysis.
Of note, no TMB‐high samples showed concurrent APC or TP53 mutations, and KRAS mutations were infrequent in these samples. Instead, mutations in genes for pathways related to APC, TP53, or KRAS were more frequently observed. In the TMB‐high subgroup, the frequency of mutations in receptor tyrosine kinase (RTK)–RAS pathway genes excluding KRAS was significantly higher than in TMB‐low samples (Table 2). Pathogenic KRAS(Gly13Asp) mutations were detected in 2 of the 14 TMB‐high samples (Figure 2A), whereas pathogenic BRAF(Val600Glu) mutations were present in 9 of the 12 TMB‐high samples with wild‐type KRAS (Figure 2B); the remaining 3 samples had mutations in RTK‐RAS pathway genes of unknown function. Phosphatidylinositol 3‐kinase (PI3K) pathway genes also showed a higher mutation rate in TMB‐high samples compared with TMB‐low samples, with PIK3CA mutations (Glu545Lys or His1047Arg) being detected in 6 of the 14 samples (Figure 2C) and PTEN mutations (Lys267Arg) in 5 samples, 4 of which overlapped with those harboring the PIK3CA mutations (Figure 2D). In addition, NOTCH pathway genes showed a significantly higher mutation rate in TMB‐high samples (Table 2), although no mutation hot spots were identified and all the mutations were benign or of unknown function.
FIGURE 2.
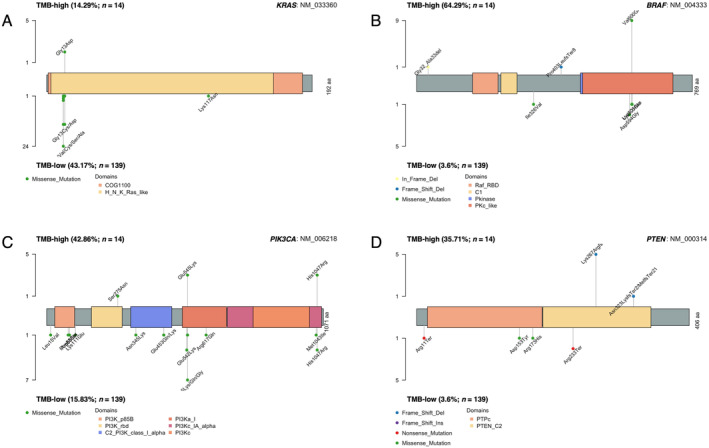
Distribution, type, and frequency of mutations within KRAS (A), BRAF (B), PIK3CA (C), and PTEN (D) for the 14 TMB‐high samples compared with the 139 TMB‐low samples.
Logistic regression analysis to adjust for nonsynonymous TMB effects were performed to investigate the association between TMB‐high or ‐low status and mutations in genes shown in Figure 1. The results for genes with a p value < 0.1 were summarized in Table 3. The logistic regression analysis revealed that APC, KRAS and PIK3CA mutations were significantly less frequent in TMB‐high samples in the context of low multicollinearity (VIF < 10), suggesting that such mutations may play a greater role in TMB‐low tumors. Conversely, genes with a higher mutation frequency in TMB‐high samples included BRAF, ARAF, and ROS1 (p value = 0.098) of the RTK‐RAS pathway; PTEN (p value = 0.092) of the PI3K pathway. These results are consistent with the oncoplot findings, suggesting that, in right‐sided tumors with a high TMB, mutations in RTK‐RAS, PI3K, and NOTCH pathway genes are more involved in carcinogenesis than are APC, TP53, or KRAS mutations.
TABLE 3.
Summary of the results for logistic regression analysis to investigate the association between TMB status and mutations, while accounting for the potential confounding effects of nonsynonymous TMB values.
| Gene | Predictor | Coefficient | CI lower | CI upper | VIF | p |
|---|---|---|---|---|---|---|
| BRAF | TMB status | −5.81 | −10.00 | −2.46 | 6.20 | 0.002 |
| NRG1 | TMB status | −4.34 | −8.10 | −1.24 | 7.00 | 0.011 |
| ARAF | TMB status | −4.30 | −8.68 | −0.49 | 2.99 | 0.030 |
| FLT3 | TMB status | −3.36 | −7.17 | −0.16 | 7.02 | 0.053 |
| PTEN | TMB status | −2.85 | −6.47 | 0.46 | 5.52 | 0.092 |
| ROS1 | TMB status | −2.50 | −5.67 | 0.43 | 5.95 | 0.098 |
| FBXW7 | TMB status | 2.92 | 0.01 | 6.18 | 5.33 | 0.062 |
| ERBB3 | TMB status | 3.52 | −0.06 | 7.86 | 5.31 | 0.078 |
| ASXL1 | TMB status | 3.60 | −0.52 | 8.06 | 8.40 | 0.095 |
| PIK3CA | TMB status | 4.37 | 1.08 | 8.05 | 6.39 | 0.013 |
| MTOR | TMB status | 4.85 | 0.53 | 10.65 | 5.17 | 0.055 |
| KRAS | TMB status | 5.25 | 2.16 | 9.18 | 3.68 | 0.003 |
| APC | TMB status | 6.09 | 2.81 | 10.17 | 6.55 | 0.001 |
| FANCD2 | TMB status | 8.41 | 2.59 | 16.89 | 5.13 | 0.021 |
Note: Results for genes with p value < 0.1 were summarized in a table that included the coefficients, confidence intervals (CI), p‐values, and variance inflation factors (VIF) for 2 covariates, (both as a binomial variable, TMB status, and as a continuous variable, TMB score). Positive coefficients for TMB status indicate a higher likelihood of gene mutation in TMB‐low tumor, while negative coefficients for TMB status indicate a higher likelihood of gene mutation in TMB‐high tumor. A VIF value lower than 10 indicates that multicollinearity between TMB status and nonsynonymous TMB is not severe, and they are sufficiently independent for reliable analysis.
Analysis of mutation allele frequency yielded the VAF rankings for each sample shown in Figure 3A. Whereas APC, TP53, and KRAS had high rankings in TMB‐low samples, other genes had higher VAF values in TMB‐high samples, indicating that APC, TP53, and KRAS mutations occur early in TMB‐low tumors whereas other genes mutate earlier in TMB‐high tumors. To identify important mutations for tumorigenesis, we plotted the number of mutations and the average VAF ranking for each gene. For the entire cohort, APC and TP53 had the highest mutation counts and high VAF rankings, followed by KRAS and PTCH1 (Figure 3B). For the TMB‐high subgroup, however, APC, TP53, and KRAS showed lower counts and rankings, whereas genes related to the DNA damage response (DDR) or MMR such as ATM, POLD1, MSH6, MSH2, POLE, EP300, and CREBBP had higher counts and rankings (Figure 3C). These findings suggested that early carcinogenic mutations in TMB‐high tumors differ from those in TMB‐low tumors.
FIGURE 3.
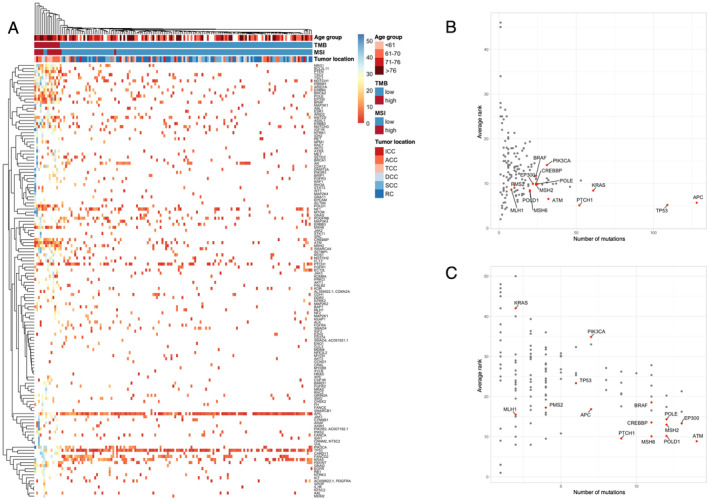
Analysis of VAF ranking for mutations according to TMB status in colorectal cancer. (A) Heat map generated by clustering of genes and samples on the basis of VAF ranking. Red or blue coloring of cells in the map indicates genes with a high or low VAF ranking within a sample, respectively. TMB, MSI, and tumor location data for each sample are also shown at the top. With the use of all 153 samples, the highest VAF of somatic mutations that does not exceed tumor purity was assigned as the VAF for each gene in each sample. Genes were ranked by VAF within each sample. (B, C) Plots of the average VAF ranking of each gene versus the number of samples with mutations both for all 153 samples (B) and the 14 TMB‐high samples (C). Gene names are displayed for genes with a high VAF ranking and high mutation count as well as for other genes of interest.
Finally, we performed mutational signature analysis to identify patterns of single‐nucleotide substitutions. The number of mutational signatures was determined to be two based on the cophenetic correlation coefficient. The two signatures derived from NMF were most similar to SBS5 (associated with age‐related changes) and SBS6 (associated with defective MMR and MSI) (Figure 4). Samples with high SBS6 and low SBS5 contributions were all TMB‐high (Figure 4A), suggesting that mutation accumulation in TMB‐high tumors is due to MSI. The SBS6 contribution was significantly higher in ascending and transverse colon cancer than in sigmoid colon cancer and rectal cancer (Figure 4B), whereas no significant differences were observed among tumor locations for the SBS5 contribution (Figure 4C). These findings indicated that ascending and transverse colon cancer are more prone to MSI‐related mutation accumulation compared with left‐sided tumors.
FIGURE 4.
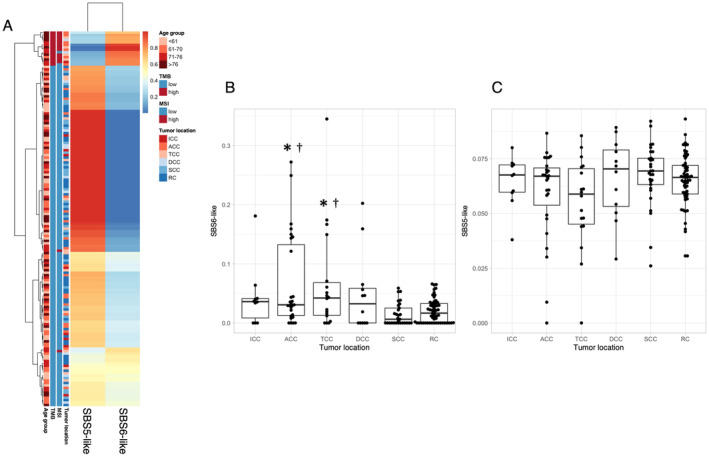
Somatic mutation patterns for synonymous and nonsynonymous substitutions in all 153 samples reconstructed with SBS6 (a signature of defective MMR) and SBS5 (a clock‐like signature). (A) Heat map generated by clustering on the basis of the proportions of each signature. Red or blue coloring of each cell in the map indicates higher or lower proportions, respectively. TMB, MSI, and tumor location data for each sample are also shown on the left. (B, C) Box plots for the contributions of SBS6 (B) and SBS5 (C) according to tumor location. *p < 0.01 versus SCC, †p < 0.01 versus RC (Benjamini‐Hochberg–corrected t test).
4. Discussion
We here analyzed targeted sequence data together with rich clinical information for colorectal cancer in order to identify mutations and their associations with clinical characteristics. We confirmed the high frequency of mutations in APC, TP53, and KRAS observed in many previous studies of colorectal cancer [3, 4, 5, 6]. In addition, we identified a subgroup of tumors, characterized by a high TMB and a preferential localization in the ascending or transverse colon, for which these mutations played a less important role in carcinogenesis. Among the 14 TMB‐high samples examined in our study, 12 were also MSI‐high, implicating MSI in their development. Of note, the molecular characteristics of TMB‐high tumors included frequent mutations in RTK‐RAS pathway genes (other than KRAS), and in PI3K pathway genes. Consistent with the association with MSI‐high status, TMB‐high tumors also showed a high frequency of mutations in genes related to DDR and MMR pathways, with such mutations likely occurring early during tumor development. Analysis of single‐nucleotide substitution patterns further revealed a substantial contribution of an MSI‐related mutational signature to TMB‐high tumors, indicating that MSI is a distinctive feature of these tumors.
Subgroups of colorectal cancer categorized on the basis of MSI and CIMP have been well characterized [16, 17, 18, 19, 20, 21, 22]. Although we did not measure CIMP, the TMB‐high subgroup was confirmed to have CIMP‐high–like characteristics including a predominant right‐sided localization, low KRAS mutation frequency, high BRAF mutation frequency, a high MSI score, and a significant contribution of an MSI‐related mutational signature. These characteristics suggest that this subgroup resembles the CIMP‐positive subgroups that were defined as Type 1 [22] or CIMP‐P2 [21] and found to have a relatively good prognosis in previous studies. Several studies have also described associations between such CIMP positivity and clinical information or specific gene mutations [16, 21, 22]. The serrated pathway, by which BRAF mutations lead to epigenomic abnormalities via methylation of MMR genes, has been proposed as a mechanism of carcinogenesis for CIMP‐positive tumors [33]. However, the possible contributions of many cancer‐related genes remain unclear. The detection of frequent BRAF mutations in the TMB‐high subgroup of the present study is suggestive of a role for the serrated pathway.
We examined the possible relations of numerous gene mutations to carcinogenesis suggested by our targeted sequencing data. By ranking VAF, we inferred the order of mutation events, noting that early clonal mutations tend to have higher frequencies [34, 35]. Unexpectedly, BRAF was not the highest ranked mutation in TMB‐high samples; instead, genes related to DDR and MMR pathways—including ATM, POLD1, MSH6, MSH2, POLE, EP300, and CREBBP—were more frequently mutated and ranked higher. We obtained similar findings for colorectal cancer cases in the International Cancer Genome Consortium (ICGC) database with > 20 mutations and VAF data. Whereas APC, TP53, KRAS, and PIK3CA were highly ranked in the analysis for all samples (Figure S1A), the ranking of TP53 and KRAS was lower and ATM and POLE ranked higher than BRAF for cases in the top 10% for TMB calculated with nonsynonymous mutations (Figure S1B). Also, we investigated whether a deviation from dependence on major mutations also occurs in TMB‐high cases of other cancer types with VAF ranking analysis using MSK‐CHOD data [36]. Mutations such as KRAS, TP53, CDKN2A, and SMAD4 in pancreatic adenocarcinoma, and TP53, PIK3CA, and GATA3 in breast invasive ductal carcinoma, which exhibit high frequency and VAF rankings across each cancer type, remained highly ranked even in TMB‐high cases. In lung adenocarcinoma, while the frequency and VAF ranking of EGFR decreased in TMB‐high cases, TP53 and KRAS maintained their high rankings. In prostate cancer, although the frequency of SPOP decreased in TMB‐high cases, it was not included in a mutation within the low‐frequency group. These findings suggest that the deviation from dependence on major mutations is specific to TMB‐high cases of colorectal cancer (Figure S2). These findings suggest that impairment of DNA repair mediated by DDR associated genes including ATM and POLE may play a role early in the serrated pathway leading to CIMP‐high status. The initial description of the serrated pathway [37] and further various studies of this pathway in genetically modified mice [38, 39, 40, 41, 42, 43, 44, 45, 46] have led to the identification of several candidate driver genes including KRAS and BRAF. However, the potential roles of DDR associated genes including ATM and POLE in this pathway have not been examined experimentally and warrant further study.
The association of the serrated pathway and BRAF mutations with tumors on the right side of the colon suggests the existence of environmental factors specific to the right colon. Given that TMB‐high tumors in our cohort tended to occur in older individuals compared with TMB‐low tumors, age may be a contributing environmental factor. Further investigations into the mechanisms responsible for the effects of gene mutations may clarify the etiology of such tumors.
Our findings implicated impairment of DNA repair as an early event in cancer development for TMB‐high tumors. In addition, we detected numerous mutations in genes related to the RTK‐RAS pathway (with the exception of KRAS), and to the PI3K pathway, suggesting a role for these pathways in tumor progression.
The RTK‐RAS pathway—including RTKs, RAS, RAF, and mitogen‐activated protein kinases (MAPKs)—contributes to the regulation of cell proliferation. KRAS mutations in colorectal cancer result in the constitutive activation of this pathway and thereby contribute to tumor formation [47, 48]. Although KRAS mutations were infrequent in the TMB‐high subgroup of the present study, all 14 such samples had mutations in RTK‐RAS pathway genes, underscoring the importance of activation of this pathway in colorectal cancer.
The PI3K pathway, which is activated by RTKs and G protein–coupled receptors, regulates various cell functions—including proliferation and the cell cycle as well as apoptosis and protein synthesis—via the protein kinase AKT [49, 50, 51]. PIK3CA mutations, which are present in ~20% of colorectal tumors [52], lead to constitutive activation of this pathway and thereby contribute to tumor formation and maintenance [53]. In the TMB‐high subgroup of our study, 13 out of 14 samples harbored mutations in PI3K pathway genes, highlighting the potential importance of PI3K pathway activation in these tumors. Comparative mutation frequency analysis between TMB‐low and TMB‐high subgroups suggested differing mechanisms of PI3K pathway activation. In TMB‐low tumors, activation appears to primarily arise through mutations in PIK3CA itself, whereas in TMB‐high tumors, it is more frequently driven by PTEN mutations that influence PIK3CA activity. In both cases, consistent with previous reports, activation of this pathway plays a pivotal role in colorectal cancer development. Previous studies have shown that PI3K pathway‐associated mutations accumulate in MSI‐high gastric adenocarcinoma. Notably, the number of mutations in PI3K pathway‐associated genes was correlated with immune cell infiltration and response to ICIs [54]. Specifically, activation of the PI3K pathway via mutations in the phosphatase domain—but not the C2 domain—of PTEN was associated with poor ICI response in gastrointestinal tumors [55]. In our study, PTEN mutations were more frequently observed in the TMB‐high/MSI‐high subset. Interestingly, in these tumors, PTEN mutations predominantly localized to the C2 domain (Figure 2D). These findings suggest that ICIs may be particularly effective for treating the TMB‐high/MSI‐high subset of colorectal cancer (CRC).
In this study, we defined TMB on the basis of the number of nonsynonymous substitutions in the targeted sequence data. According to this definition, TMB‐high status is thought to correlate with neoantigen variation. In addition, by using an oncoplot to visualize the overall mutations in the cohort (Figure 1), it was observed that cases with TMB‐high had fewer mutations in APC, TP53, and KRAS, while exhibiting more mutations in other genes. These findings suggest that TMB‐high tumors, which are less dependent on APC, TP53, and KRAS mutations for their development and malignancy, are likely formed by a more heterogeneous population of tumor cells. Drugs that target cancer immunity might therefore be expected to be effective for the TMB‐high subgroup of tumors identified in the present study. Our analysis of mutational signatures and VAF rankings further suggests that MSI is associated with the development and malignancy of this subgroup. However, two MSI‐high samples in our cohort were not classified in the TMB‐high subgroup. These two samples did not harbor BRAF mutations or mutations in the DDR‐related genes POLE and POLD1 (Figure S1), suggestive of a different mechanism of cancer development and a lesser impairment of DNA repair compared with the TMB‐high subgroup, potentially resulting in different responses to drugs targeting cancer immunity.
In conclusion, we have here defined and characterized a TMB‐high subgroup of colorectal cancer from clinical and molecular perspectives. This TMB‐high subgroup appears to be similar to previously defined CIMP‐high subgroups, being associated with early involvement of mutations in genes related to MMR and DDR in addition to those in BRAF. Activation of the RTK‐RAS and PI3K pathways was also implicated in the maintenance of tumor survival. Furthermore, this subgroup is likely composed of highly heterogeneous cell populations and associated with the expression of numerous neoantigens. Future research is warranted to examine the relation between TMB‐high status and the efficacy of immune checkpoint inhibitors and thereby to clarify the clinical outcome and molecular biological definition of TMB‐high tumors.
Author Contributions
Yuko Chikaishi: conceptualization, data curation, formal analysis, investigation, writing – original draft. Hiroshi Matsuoka: conceptualization, formal analysis, investigation. Eiji Sugihara: data curation, methodology, resources. Mayu Takeda: data curation, methodology. Makoto Sumitomo: conceptualization, data curation. Seiji Yamada: data curation, methodology. Gaku Inaguma: project administration. Yusuke Omura: project administration. Yeongcheol Cheong: project administration. Yosuke Kobayashi: project administration. Masaya Nakauchi: project administration. Junichiro Hiro: project administration. Koji Masumori: project administration. Koki Otsuka: project administration. Hiroshi Nishihara: methodology. Koichi Suda: supervision. Hideyuki Saya: conceptualization, formal analysis, funding acquisition, investigation, supervision, writing – review and editing. Tetsuya Takimoto: conceptualization, data curation, formal analysis, investigation, methodology, software, validation, visualization, writing – original draft, writing – review and editing.
Ethics Statement
Approval of the research protocol by an Institutional Reviewer Board: Ethics Committee of Fujita Health University Hospital (Approval Number: HM21‐172).
Informed Consent: N/A.
Registry and the Registration No. of the study/trial: N/A.
Animal Studies: N/A.
Conflicts of Interest
Nishihara, Hiroshi and Saya, Hideyuki is an editorial board member of Cancer Science. Other authors do not have a conflicts of interest.
Supporting information
Figure S1. Analysis of VAF ranking for the 753 colorectal cancer samples in the ICGC database.
Figure S2. Comparison of VAF ranking among pancreatic adenocarcinoma, breast invasive ductal carcinoma, lung adenocarcinoma, prostate adenocarcinoma, and colon adenocarcinoma in MSK‐CHORD.
Figure S3. Analysis of VAF ranking for the 16 samples that are either TMB‐high or MSI‐high.
Acknowledgments
The authors wish to acknowledge Ippei Sakamoto, Sachio Nohara, and Shigeki Tanishima, Mitsubishi Electric Software Corporation, for helping the significance of decision of data analysis direction by giving the information of method for adding mutational annotations.
Funding: This study was supported by Grants‐in‐Aid for Scientific Research from the Ministry of Education, Culture, Sports, Science, and Technology of Japan (KAKENHI 23H00410 to H.S.).
References
- 1. Fearon E. R. and Vogelstein B., “A Genetic Model for Colorectal Tumorigenesis,” Cell 61, no. 5 (1990): 759–767, 10.1016/0092-8674(90)90186-i. [DOI] [PubMed] [Google Scholar]
- 2. Smith G., Carey F. A., Beattie J., et al., “Mutations in APC, Kirsten‐Ras, and p53–Alternative Genetic Pathways to Colorectal Cancer,” Proceedings of the National Academy of Sciences of the United States of America 99, no. 14 (2002): 9433–9438, 10.1073/pnas.122612899. [DOI] [PMC free article] [PubMed] [Google Scholar]
- 3. Cancer Genome Atlas N , “Comprehensive Molecular Characterization of Human Colon and Rectal Cancer,” Nature 487 (2012): 330–337, 10.1038/nature11252. [DOI] [PMC free article] [PubMed] [Google Scholar]
- 4. Jauhri M., Bhatnagar A., Gupta S., et al., “Prevalence and Coexistence of KRAS, BRAF, PIK3CA, NRAS, TP53, and APC Mutations in Indian Colorectal Cancer Patients: Next‐Generation Sequencing–Based Cohort Study,” Tumor Biology 39, no. 2 (2017): 1010428317692265, 10.1177/1010428317692265. [DOI] [PubMed] [Google Scholar]
- 5. Wang F., Cheng H., Zhang X., et al., “Comparative Genomic Signatures in Young and Old Chinese Patients With Colorectal Cancer,” Cancer Medicine 10, no. 13 (2021): 4375–4386, 10.1002/cam4.3987. [DOI] [PMC free article] [PubMed] [Google Scholar]
- 6. Ciepiela I., Szczepaniak M., Ciepiela P., et al., “Tumor Location Matters, Next Generation Sequencing Mutation Profiling of Left‐Sided, Rectal, and Right‐Sided Colorectal Tumors in 552 Patients,” Scientific Reports 14, no. 1 (2024): 4619, 10.1038/s41598-024-55139-w. [DOI] [PMC free article] [PubMed] [Google Scholar]
- 7. Puccini A., Marshall J. L., and Salem M. E., “Molecular Variances Between Right‐ and Left‐Sided Colon Cancers,” Current Colorectal Cancer Reports 14 (2018): 152–158, 10.1007/s11888-018-0411-z. [DOI] [Google Scholar]
- 8. Hugen N., Brown G., Glynne‐Jones R., de Wilt J. H. W., and Nagtegaal I. D., “Advances in the Care of Patients With Mucinous Colorectal Cancer,” Nature Reviews Clinical Oncology 13, no. 6 (2016): 361–369, 10.1038/nrclinonc.2015.140. [DOI] [PubMed] [Google Scholar]
- 9. Baran B., Ozupek N. M., Tetik N. Y., Acar E., Bekcioglu O., and Baskin Y., “Difference Between Left‐Sided and Right‐Sided Colorectal Cancer: A Focused Review of Literature,” Gastroenterology Research 11, no. 4 (2018): 264–273, 10.14740/gr1062w. [DOI] [PMC free article] [PubMed] [Google Scholar]
- 10. Galon J., Costes A., Sanchez‐Cabo F., et al., “Type, Density, and Location of Immune Cells Within Human Colorectal Tumors Predict Clinical Outcome,” Science 313, no. 5795 (2006): 1960–1964, 10.1126/science.1129139. [DOI] [PubMed] [Google Scholar]
- 11. Haggar F. A. and Boushey R. P., “Colorectal Cancer Epidemiology: Incidence, Mortality, Survival, and Risk Factors,” Clinics in Colon and Rectal Surgery 22, no. 4 (2009): 191–197, 10.1055/s-0029-1242458. [DOI] [PMC free article] [PubMed] [Google Scholar]
- 12. Benedix F., Kube R., Meyer F., Schmidt U., Gastinger I., and Lippert H., “Comparison of 17,641 Patients With Right‐ and Left‐Sided Colon Cancer: Differences in Epidemiology, Perioperative Course, Histology, and Survival,” Diseases of the Colon and Rectum 53, no. 1 (2010): 57–64, 10.1007/DCR.0b013e3181c703a4. [DOI] [PubMed] [Google Scholar]
- 13. Meguid R. A., Slidell M. B., Wolfgang C. L., Chang D. C., and Ahuja N., “Is There a Difference in Survival Between Right‐ Versus Left‐Sided Colon Cancers?,” Annals of Surgical Oncology 15, no. 9 (2008): 2388–2394, 10.1245/s10434-008-0015-y. [DOI] [PMC free article] [PubMed] [Google Scholar]
- 14. Ribic C. M., Sargent D. J., Moore M. J., et al., “Tumor Microsatellite‐Instability Status as a Predictor of Benefit From Fluorouracil‐Based Adjuvant Chemotherapy for Colon Cancer,” New England Journal of Medicine 349, no. 3 (2003): 247–257, 10.1056/NEJMoa022289. [DOI] [PMC free article] [PubMed] [Google Scholar]
- 15. Petrelli F., Tomasello G., Borgonovo K., et al., “Prognostic Survival Associated With Left‐Sided vs Right‐Sided Colon Cancer: A Systematic Review and Meta‐Analysis,” JAMA Oncology 3, no. 2 (2017): 211–219, 10.1001/jamaoncol.2016.4227. [DOI] [PubMed] [Google Scholar]
- 16. Ogino S., Nosho K., Kirkner G. J., et al., “CpG Island Methylator Phenotype, Microsatellite Instability, BRAF Mutation and Clinical Outcome in Colon Cancer,” Gut 58, no. 1 (2009): 90–96, 10.1136/gut.2008.155473. [DOI] [PMC free article] [PubMed] [Google Scholar]
- 17. Douillard J. Y., “Microsatellite Instability and Mismatch Repair Genes in Colorectal Cancer: Useful Tools for Managing Patients and Counseling Their Relatives,” Clinical Colorectal Cancer 9, no. 4 (2010): 193–194, 10.3816/CCC.2010.n.028. [DOI] [PubMed] [Google Scholar]
- 18. Boland C. R. and Goel A., “Microsatellite Instability in Colorectal Cancer,” Gastroenterology 138, no. 6 (2010): 2073–2087, 10.1053/j.gastro.2009.12.064. [DOI] [PMC free article] [PubMed] [Google Scholar]
- 19. Yamauchi M., Morikawa T., Kuchiba A., et al., “Assessment of Colorectal Cancer Molecular Features Along Bowel Subsites Challenges the Conception of Distinct Dichotomy of Proximal Versus Distal Colorectum,” Gut 61, no. 6 (2012): 847–854, 10.1136/gutjnl-2011-300865. [DOI] [PMC free article] [PubMed] [Google Scholar]
- 20. Phipps A. I., Limburg P. J., Baron J. A., et al., “Association Between Molecular Subtypes of Colorectal Cancer and Patient Survival,” Gastroenterology 148, no. 1 (2015): 77–87, 10.1053/j.gastro.2014.09.038. [DOI] [PMC free article] [PubMed] [Google Scholar]
- 21. Bae J. M., Kim J. H., Kwak Y., et al., “Distinct Clinical Outcomes of Two CIMP‐Positive Colorectal Cancer Subtypes Based on a Revised CIMP Classification System,” British Journal of Cancer 116, no. 8 (2017): 1012–1020, 10.1038/bjc.2017.52. [DOI] [PMC free article] [PubMed] [Google Scholar]
- 22. Murcia O., Juárez M., Rodríguez‐Soler M., et al., “Colorectal Cancer Molecular Classification Using BRAF, KRAS, Microsatellite Instability and CIMP Status: Prognostic Implications and Response to Chemotherapy,” PLoS One 13, no. 9 (2018): e0203051, 10.1371/journal.pone.0203051. [DOI] [PMC free article] [PubMed] [Google Scholar]
- 23. Aiderus A., Barker N., and Tergaonkar V., “Serrated Colorectal Cancer: Preclinical Models and Molecular Pathways,” Trends in Cancer 10, no. 1 (2024): 76–91, 10.1016/j.trecan.2023.09.011. [DOI] [PubMed] [Google Scholar]
- 24. Nukaya T., Sumitomo M., Sugihara E., et al., “Estimating Copy Number to Determine BRCA2 Deletion Status and to Expect Prognosis in Localized Prostate Cancer,” Cancer Medicine 12, no. 7 (2023): 8154–8165, 10.1002/cam4.5617. [DOI] [PMC free article] [PubMed] [Google Scholar]
- 25. Niu B., Ye K., Zhang Q., et al., “MSIsensor: Microsatellite Instability Detection Using Paired Tumor‐Normal Sequence Data,” Bioinformatics 30, no. 7 (2014): 1015–1016, 10.1093/bioinformatics/btt755. [DOI] [PMC free article] [PubMed] [Google Scholar]
- 26. Middha S., Zhang L., Nafa K., et al., “Reliable Pan‐Cancer Microsatellite Instability Assessment by Using Targeted Next‐Generation Sequencing Data,” JCO Precision Oncology 1 (2017): 1–17, 10.1200/PO.17.00084. [DOI] [PMC free article] [PubMed] [Google Scholar]
- 27. Kandoth C., “mskcc/vcf2maf: vcf2maf v1.6.19,” (2020), 10.5281/zenodo.593251. [DOI]
- 28. R Core Team , R: A Language and Environment for Statistical Computing (Vienna, Austria: RFoundation for Statistical Computing, 2023), https://www.R‐project.org/. [Google Scholar]
- 29. Mayakonda A., Lin D. C., Assenov Y., Plass C., and Koeffler H. P., “Maftools: Efficient and Comprehensive Analysis of Somatic Variants in Cancer,” Genome Research 28, no. 11 (2018): 1747–1756, 10.1101/gr.239244.118. [DOI] [PMC free article] [PubMed] [Google Scholar]
- 30. Gaujoux R. and Seoighe C., “A Flexible R Package for Nonnegative Matrix Factorization,” BMC Bioinformatics 11 (2010): 367, 10.1186/1471-2105-11-367. [DOI] [PMC free article] [PubMed] [Google Scholar]
- 31. Manders F., Brandsma A. M., de Kanter J., et al., “MutationalPatterns: The One Stop Shop for the Analysis of Mutational Processes,” BMC Genomics 23, no. 1 (2022): 134, 10.1186/s12864-022-08357-3. [DOI] [PMC free article] [PubMed] [Google Scholar]
- 32. Kolde R., “pheatmap: Pretty Heatmaps. R package version 1.0.12,” (2019), https://CRAN.R‐project.org/package=pheatmap.
- 33. Ijspeert J. E. G., Vermeulen L., Meijer G. A., and Dekker E., “Serrated Neoplasia‐Role in Colorectal Carcinogenesis and Clinical Implications,” Nature Reviews Gastroenterology and Hepatology 12, no. 7 (2015): 401–409, 10.1038/nrgastro.2015.73. [DOI] [PubMed] [Google Scholar]
- 34. Beerenwinkel N., Schwarz R. F., Gerstung M., and Markowetz F., “Cancer Evolution: Mathematical Models and Computational Inference,” Systematic Biology 64, no. 1 (2015): e1–e25, 10.1093/sysbio/syu081. [DOI] [PMC free article] [PubMed] [Google Scholar]
- 35. Williams M. J., Werner B., Barnes C. P., Graham T. A., and Sottoriva A., “Identification of Neutral Tumor Evolution Across Cancer Types,” Nature Genetics 48, no. 3 (2016): 238–244, 10.1038/ng.3489. [DOI] [PMC free article] [PubMed] [Google Scholar]
- 36. Jee J., Fong C., Pichotta K., et al., “Automated Real‐World Data Integration Improves Cancer Outcome Prediction,” Nature 636, no. 8043 (2024): 728–736, 10.1038/s41586-024-08167-5. [DOI] [PMC free article] [PubMed] [Google Scholar]
- 37. Longacre T. A. and Fenoglio‐Preiser C. M., “Mixed Hyperplastic Adenomatous Polyps/Serrated Adenomas. A Distinct Form of Colorectal Neoplasia,” American Journal of Surgical Pathology 14, no. 6 (1990): 524–537, 10.1097/00000478-199006000-00003. [DOI] [PubMed] [Google Scholar]
- 38. Carragher L. A. S., Snell K. R., Giblett S. M., et al., “V600EBraf Induces Gastrointestinal Crypt Senescence and Promotes Tumour Progression Through Enhanced CpG Methylation of p16INK4a,” EMBO Molecular Medicine 2, no. 11 (2010): 458–471, 10.1002/emmm.201000099. [DOI] [PMC free article] [PubMed] [Google Scholar]
- 39. Bennecke M., Kriegl L., Bajbouj M., et al., “Ink4a/Arf and Oncogene‐Induced Senescence Prevent Tumor Progression During Alternative Colorectal Tumorigenesis,” Cancer Cell 18, no. 2 (2010): 135–146, 10.1016/j.ccr.2010.06.013. [DOI] [PubMed] [Google Scholar]
- 40. Sakamoto N., Feng Y., Stolfi C., et al., “BRAFV600E Cooperates With CDX2 Inactivation to Promote Serrated Colorectal Tumorigenesis,” eLife 6 (2017): e20331, 10.7554/eLife.20331. [DOI] [PMC free article] [PubMed] [Google Scholar]
- 41. Nakanishi Y., Duran A., L'Hermitte A., et al., “Simultaneous Loss of Both Atypical Protein Kinase C Genes in the Intestinal Epithelium Drives Serrated Intestinal Cancer by Impairing Immunosurveillance,” Immunity 49, no. 6 (2018): 1132–1147, 10.1016/j.immuni.2018.09.013. [DOI] [PMC free article] [PubMed] [Google Scholar]
- 42. Jackstadt R., van Hooff S. R., Leach J. D., et al., “Epithelial NOTCH Signaling Rewires the Tumor Microenvironment of Colorectal Cancer to Drive Poor‐Prognosis Subtypes and Metastasis,” Cancer Cell 36, no. 3 (2019): 319–336, 10.1016/j.ccell.2019.08.003. [DOI] [PMC free article] [PubMed] [Google Scholar]
- 43. Linares J. F., Zhang X., Martinez‐Ordoñez A., et al., “PKCλ/ι Inhibition Activates an ULK2‐Mediated Interferon Response to Repress Tumorigenesis,” Molecular Cell 81, no. 21 (2021): 4509–4526, 10.1016/j.molcel.2021.08.039. [DOI] [PMC free article] [PubMed] [Google Scholar]
- 44. Destefano Shields C. E., White J. R., Chung L., et al., “Bacterial‐Driven Inflammation and Mutant Braf Expression Combine to Promote Murine Colon Tumorigenesis That Is Sensitive to Immune Checkpoint Therapy,” Cancer Discovery 11, no. 7 (2021): 1792–1807, 10.1158/2159-8290.CD-20-0770. [DOI] [PMC free article] [PubMed] [Google Scholar]
- 45. Leach J. D. G., Vlahov N., Tsantoulis P., et al., “Oncogenic BRAF, Unrestrained by TGFβ‐Receptor Signalling, Drives Right‐Sided Colonic Tumorigenesis,” Nature Communications 12, no. 1 (2021): 3436, 10.1038/s41467-021-23717-5. [DOI] [PMC free article] [PubMed] [Google Scholar]
- 46. Tong K., Kothari O. A., Haro K. S., et al., “SMAD4 Is Critical in Suppression of BRAF‐V600E Serrated Tumorigenesis,” Oncogene 40, no. 41 (2021): 6034–6048, 10.1038/s41388-021-01997-x. [DOI] [PMC free article] [PubMed] [Google Scholar]
- 47. Karnoub A. E. and Weinberg R. A., “Ras Oncogenes: Split Personalities,” Nature Reviews. Molecular Cell Biology 9, no. 7 (2008): 517–531, 10.1038/nrm2438. [DOI] [PMC free article] [PubMed] [Google Scholar]
- 48. Bahar M. E., Kim H. J., and Kim D. R., “Targeting the RAS/RAF/MAPK Pathway for Cancer Therapy: From Mechanism to Clinical Studies,” Signal Transduction and Targeted Therapy 8, no. 1 (2023): 455, 10.1038/s41392-023-01705-z. [DOI] [PMC free article] [PubMed] [Google Scholar]
- 49. Katso R., Okkenhaug K., Ahmadi K., White S., Timms J., and Waterfield M. D., “Cellular Function of Phosphoinositide 3‐Kinases: Implications for Development, Homeostasis, and Cancer,” Annual Review of Cell and Developmental Biology 17, no. 1 (2001): 615–675, 10.1146/annurev.cellbio.17.1.615. [DOI] [PubMed] [Google Scholar]
- 50. Sarbassov D. D., Guertin D. A., Ali S. M., and Sabatini D. M., “Phosphorylation and Regulation of Akt/PKB by the Rictor‐mTOR Complex,” Science 307, no. 5712 (2005): 1098–1101, 10.1126/science.1106148. [DOI] [PubMed] [Google Scholar]
- 51. Hemmings B. A. and Restuccia D. F., “PI3K‐PKB/Akt Pathway,” Cold Spring Harbor Perspectives in Biology 4, no. 9 (2012): a011189, 10.1101/cshperspect.a011189. [DOI] [PMC free article] [PubMed] [Google Scholar]
- 52. Mei Z. B., Duan C. Y., Li C. B., Cui L., and Ogino S., “Prognostic Role of Tumor PIK3CA Mutation in Colorectal Cancer: A Systematic Review and Meta‐Analysis,” Annals of Oncology 27, no. 10 (2016): 1836–1848, 10.1093/annonc/mdw264. [DOI] [PMC free article] [PubMed] [Google Scholar]
- 53. Engelman J. A., “Targeting PI3K Signalling in Cancer: Opportunities, Challenges and Limitations,” Nature Reviews Cancer 9, no. 8 (2009): 550–562, 10.1038/nrc2664. [DOI] [PubMed] [Google Scholar]
- 54. Wang Z., Wang X., Xu Y., et al., “Mutations of PI3K‐AKT‐mTOR Pathway as Predictors for Immune Cell Infiltration and Immunotherapy Efficacy in dMMR/MSI‐H Gastric Adenocarcinoma,” BMC Medicine 20, no. 1 (2022): 133, 10.1186/s12916-022-02327-y. [DOI] [PMC free article] [PubMed] [Google Scholar]
- 55. Chida K., Kawazoe A., Kawazu M., et al., “A Low Tumor Mutational Burden and PTEN Mutations Are Predictors of a Negative Response to PD‐1 Blockade in MSI‐H/dMMR Gastrointestinal Tumors,” Clinical Cancer Research 27, no. 13 (2021): 3714–3724, 10.1158/1078-0432.CCR-21-0401. [DOI] [PubMed] [Google Scholar]
Associated Data
This section collects any data citations, data availability statements, or supplementary materials included in this article.
Supplementary Materials
Figure S1. Analysis of VAF ranking for the 753 colorectal cancer samples in the ICGC database.
Figure S2. Comparison of VAF ranking among pancreatic adenocarcinoma, breast invasive ductal carcinoma, lung adenocarcinoma, prostate adenocarcinoma, and colon adenocarcinoma in MSK‐CHORD.
Figure S3. Analysis of VAF ranking for the 16 samples that are either TMB‐high or MSI‐high.