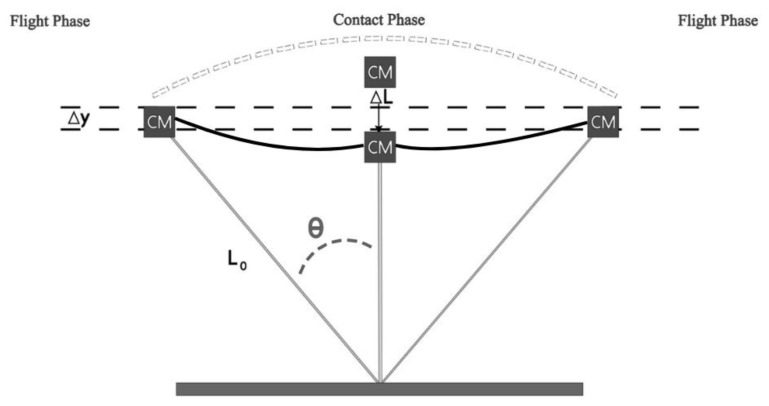
Figure 2.
The spring-mass model utilized to determine the stiffness of the leg during the gait cycle. L0 is resting leg length. ΔL depicts the maximal compression of leg during stance phase of the gait cycle. Δy depicts the vertical displacement of center of mass during the gait cycle. θ depicts half the angle traversed by the leg during the stance phase of the gait cycle. Adapted from Figure 2, Li et al., 2019. 13

