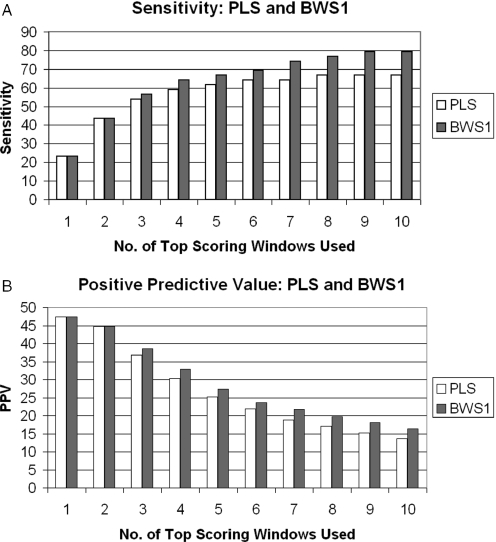
Figure 3.
Sensitivity and positive predictive values of the PLS and BWS. In our context, sensitivity is the percentage of known origins that are close to the regions suggested by the prediction; and positive predictive value is the percentage of identified regions that are close to the known origins. The sensitivity and positive predictive values of the PCS are 15 and 25, respectively.

