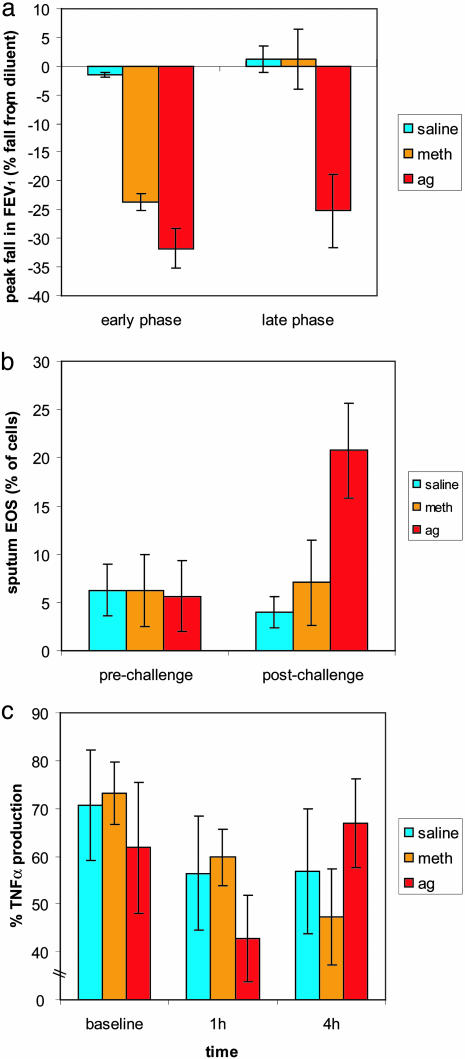
Fig. 2.
Greater inflammatory potential and decreased lung function during an Ag challenge. (a) Peak fall in FEV1 during the early (1 h) and late phase (6–8 h) of each challenge (phase × challenge interaction; F (2, 4) = 24.2, P < 0.01). (b) Percentage of EOS before and 24 h after the challenge (time × challenge interaction; F (2, 4) = 26.4, P < 0.01). (c) PBL production of TNF-α (% of production relative to no DEX) at baseline (before), early phase (1 h after) and late phase (4 h after) (phase × challenge interaction; F (4, 16) = 5.06, P < 0.01). Error bars represent standard error of the mean.

