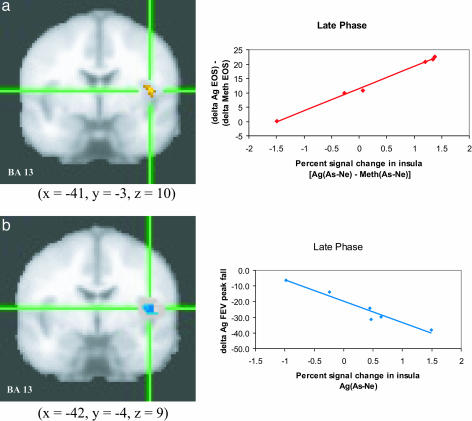
Fig. 4.
Insula activity predicts peripheral measures of inflammatory potential and lung function. Percent signal change in the left insula in response to As compared with Ne words [As - Ne] and percentage of EOS during late-phase antigen relative to methacholine challenge [Ag - Meth] (a)(r = 0.99, P < 0.001) and peak fall FEV1 during late phase antigen [Ag] challenge (b) (r = -0.97, P < 0.01). Note that clusters in a and b were identified independently and are not identical, although they largely overlap. For analyses with FEV1, only values for the Ag challenge were used because one participant was missing data from the Meth challenge.

