

Abstract
For many locally advanced tumors, the chemotherapy-radiotherapy (CT-RT) combination (“chemoradiation”) is currently the standard of care. Intratumoral (IT) CT-based chemoradiation has the potential to overcome the limitations of conventional systemic CT-RT (side effects). For maximizing the benefits of IT CT-RT, our laboratory has previously developed a radiation-controlled drug release formulation, in which anticancer drug paclitaxel (PTX) and radioluminescent CaWO4 (CWO) nanoparticles (NPs) are co-encapsulated with poly(ethylene glycol)-poly(lactic acid) (PEG-PLA) block copolymers (“PEG-PLA/CWO/PTX NPs”). These PEG-PLA/CWO/PTX NPs enable radiation-controlled release of PTX, and are capable of producing sustained therapeutic effects lasting for at least one month following a single IT injection. The present article focuses on discussing our recent finding about the effect of the stereochemical structure of PTX on the efficacy of this PEG-PLA/CWO/PTX NP formulation. Stereochemical differences in two different PTX compounds (“PTX-S” from Samyang Biopharmaceuticals, and “PTX-B” from Biotang) were characterized by 2D heteronuclear/homonuclear NMR, Raman spectroscopy and circular dichroism measurements. The difference in PTX stereochemistry was found to significantly influence their water solubility (WS); PTX-S (WS ≈ 4.69 μg/mL) is about 19 times more water soluble than PTX-B (WS ≈ 0.25 μg/mL). The two PTX compounds showed similar cancer cell-killing performances in vitro, when used as free drugs. However, the subtle stereochemical difference significantly influenced their X-ray-triggered release kinetics from the PEG-PLA/CWO/PTX NPs; the more water-soluble PTX-S was released faster than the less water-soluble PTX-B. This difference was manifested in the IT pharmacokinetics and eventually in the survival percentages of test animals (mice) treated with PEG-PLA/CWO/PTX NPs + X-rays in an in vivo human tumor xenograft study; at short times (< 1 month), concurrent PEG-PLA/CWO/PTX-S NPs produced a greater tumor suppression effect, whereas PEG-PLA/CWO/PTX-B NPs had a longer lasting radio-sensitizing effect. This study demonstrates the importance of the stereochemistry of a drug in a therapy based on a controlled release formulation.
Keywords: Paclitaxel; stereochemistry; radiation-controlled drug release; radioluminescent CaWO4 nanoparticle; poly(ethylene glycol)-poly(D,L-lactic acid)
Graphical Abstract

1. Introduction
Arguably, paclitaxel (PTX) is the most successful anticancer drug in history [1] . PTX was the first cancer drug whose annual global sales reached $1 billion in 1997, and it achieved an all-time high annual turnover of $1.6 billion worldwide in 2001 [2]. Although PTX has been used in clinics for decades now, research is still on the rise to develop improved delivery systems for this drug [3]. The past decade (2009 – 2018) has seen a staggering 113% and 79% increases in the numbers of patents on oral and parenteral PTX delivery systems, respectively, relative to the prior decade (1999 – 2008), underscoring the still transformative nature of this field [3]. Specifically, the number per decade of nanomaterial-based oral/parenteral PTX delivery patents has increased by > 100% between 1998 to 2018 [3]. Since its discovery in the 1960s, PTX has become an indispensable drug in the fight against cancer.
PTX was first derived from the bark of the Pacific yew tree in the early 1960s during a large-scale natural product screening program instituted by the National Cancer Institute (NCI) [1]. PTX elicits cytotoxic effects in cancer cells, including leukemia, carcinoma and sarcoma cells, of both human and rodent/murine origins [4, 5]. The identification of PTX as the compound responsible for the anticancer effect produced by the Pacific yew tree extract led to the fast-tracked evaluation of this compound as a candidate cancer therapeutic in clinical trials [6]. The increased demand for PTX after successful human clinical trials necessitated the development of an alternative PTX production method for sustainable production of the drug and also for preservation of Pacific yew [7]. This need prompted an R&D partnership between the NCI and Bristol Myers Squibb (BMS), which resulted in the development of a process for large-scale production of PTX from twigs and needles from Pacific yew in 1991 [1]; this process was more sustainable than producing PTX from the inner bark of the tree, which basically kills the tree; this process involved semi-synthetic production in which PTX precursors were first isolated from Pacific yew’s twigs and needles, and then converted into PTX through extensive chemical reactions. However, modern industrial PTX manufacturing has since pivoted to cell culture processes in order to meet even increased demands [8]. Currently, Phyton Biotech (Canada) houses the world’s largest cell culture operation that produces most of the PTX supply to the world [9]. Thanks to the advantage of producing PTX at higher yields, plant cell culture has become the industry standard with other top manufacturers, such as Samyang Biopharmaceuticals (South Korea), adopting it for its commercial production of PTX.
The mechanism behind the cytotoxic effect of PTX was discovered by Horwitz and Schiff in 1979 who showed that the primary mode of action is the stabilization of tubulin subunits by PTX during the mitotic phase [10]. Tubulin subunits are monomers that constitute microtubules, the primary components of the mitotic spindle apparatus [11]. The increased stability of microtubules in the presence of PTX inhibits the reorganization of the microtubule network, arrests the cell in the G2 and M phases during the cell division process, and ultimately causes mitotic catastrophe and apoptotic cell death [1, 10, 12]. When used in combination with radiotherapy, PTX produces radio-sensitizing effects because it causes a cell cycle arrest in the most radio-sensitive G2/M phase [13-15]. Cancer cells have been shown to become more responsive to lower doses of radiation after treatment with PTX, proving its utility as a radiosensitizer [15, 16]. The added benefit of radio-sensitization makes PTX a highly potent drug for use in chemo radio combination therapy.
Despite its therapeutic effectiveness, PTX suffers from a crucial drawback—poor water solubility [17]. Being practically insoluble in water, PTX needs a solubilizer for systemic (e.g., intravenous (IV)) administration. One example is Cremophor-EL (CrEL), a polyoxyethylene castor oil derivative (a nonionic surfactant), used as the vehicle in the commercial PTX formulation called Taxol® (BMS) [18]. IV-infused Taxol (which also contains ethanol) has been shown to cause Grade I – Grade IV toxicity in the majority of patients who received it [18, 19]. Currently, chemoradiation (concurrent/sequential chemotherapy-radiotherapy combination (CT-RT)) is the standard treatment for patients with inoperable/locally advanced cancer, because this combination produces benefits in terms of tumor response and overall survival relative to either alone [20]. Unfortunately, however, using chemotherapeutic drugs on top of radiation significantly increases side effects, resulting in a progressive worsening of the quality of life for patients [21-24]. The seriousness of side effects of conventional chemoradiation (CT-RT) raises a need for tumor-specific radio-sensitization.
Nanoparticulate drug delivery systems have been developed for tumor-targeted delivery of PTX. Examples include Abraxane® (albumin-conjugated PTX) which was FDA approved in 2005 [25]. Abraxane does not require an organic solvent or a solubilizer, is IV administered with saline solution, and thus carries significantly reduced side effects [26]. Genexol-PM® is a poly(ethylene glycol)-poly(lactic acid) (PEG-PLA) block copolymer nano micelle formulation of PTX that has been approved in South Korea [27]. Hydrophobic drugs such as PTX are encapsulated inside the core domains of polymeric micelles [28-30]. The PEG corona of polymer micelles provides for shielding against rapid clearance by the phagocyte system and thus increases the circulation time of the micelle and the bioavailability of the drug [28, 31, 32]. However, these nano delivery systems are still fall short of completely eliminating the off-target toxicity of systemic CT.
Using deep-penetrating ionizing radiation (such as X-rays) as a triggering mechanism for drug release is gaining increasing attention because of its applicability to deep-seated tumors. This radiation-controlled drug release approach has advantages over other stimuli-responsive drug release mechanisms. Tumor microenvironment-responsive drug delivery systems (such as pH, hypoxia and enzyme-responsive systems) [33-37] do not allow external control of the release kinetics. Drug carriers responsive to external stimuli such as heat [38, 39] or light [40, 41] are not optimal for treating deep tissue tumors. External X-ray beam radiation is unique in its ability to deep penetrate tissue layers [42] and is thus an attractive means to control drug release kinetics and thereby to achieve maximum intratumoral bioavailability and minimum off-target adverse effects of the drug. X-rays (1 – 4 Gy, 6 MeV) have been shown to be able to trigger doxorubicin (DOX) release from gold nanoparticle/photosensitizer-coloaded liposomes [43]; under X-ray irradiation, gold nanoparticles and photosensitizers produce reactive oxygen species (ROS) which destabilize the lipid membrane and cause the release of the encapsulated DOX. X-ray-triggered release of DOX has also been demonstrated with a diselenide-based triblock copolymer micelle formulation under low-dose irradiation (2 Gy, energy unspecified) [44]; in an H2O2-rich environment, H2O2 forms complexes with selenyl radicals produced by X-rays, and thus prevents them from recombining; the cleavage of diselenide causes the disintegration of the micelle, resulting in the release of DOX from it. Higher doses of X-rays (5 – 7 Gy, energy unspecified) have been shown to be able to trigger DOX release from polyamidoamine-based dendrimers [45]; the DOX release was achieved by the breakage of disulfide bonds within a polyamidoamine dendrimer modified with L-cysteine residues. It has been reported that DOX was released from poly(ethylene glycol)-poly(ε-caprolactone) (PEG-PCL) micelles coloaded with DOX and chlorin e6 (Ce6, a photosensitizer) after exposure to high-dose X-rays (10 – 50 Gy, 240 keV) [46]. However, prior to ours, no formulation had been shown to be capable of efficiently releasing drug without the aid of a photosensitizer in a H2O2-free environment in response to the low (2 Gy) X-ray dose used in standard fractionated radiotherapy [47]. Higher doses of X-rays cause genotoxicity and increase chances of radiation-induced cancer [48, 49]. A X-ray-triggered drug release system that works for a certain type of drug may not work for other drugs [46].
Our laboratory has recently developed a low dose X-ray radiation-controlled drug release (RCDR) platform [50]. In this RCDR system, anticancer drugs (such as paclitaxel (PTX)) are co-encapsulated with non-toxic radioluminescent CaWO4 (CWO for short) nanoparticles (NPs) within protective capsules formed by biosafe PEG-PLA block copolymers (Figure 1) [50]. Under X-ray irradiation, radioluminescent CWO NPs produce UV-A/blue light (320 – 400 nm)[51] that, combined with X-rays, triggers degradation of PLA and release of drugs from the PLA coating (Figure 1). In the absence of radiation, these drug-loaded PEG-PLA-encapsulated CWO NPs (“PEG-PLA/CWO/PTX NPs”) showed very low drug (PTX) release. In contrast, upon exposure to 7 Gy X-Ray dose, a sudden burst release of PTX was observed; this radiation-triggered release phase was followed by a slower release phase over the remaining non-irradiated period. Similar PTX release profiles were observed at lower X-ray doses (e.g., at the clinical 2 Gy per fraction dose), and the PTX release rate was linearly proportional to radiation dose. The results of the evaluation of radio-sensitization efficacy in HN31 (p53-mutant (radio-resistant) human head and neck cancer) cells in vitro and also in mice bearing HN31 xenografts in vivo validated that PEG-PLA/CWO/PTX NPs are indeed capable of inducing a significant synergistic enhancement of the effect of X-rays. CWO NPs are biosafe [52], and they bring additional benefits of producing some level of photodynamic therapy effects [53-55].
Figure 1. Schematic explanation of the working of the “PEG-PLA/CWO/PTX NP” radiation-controlled drug release system.
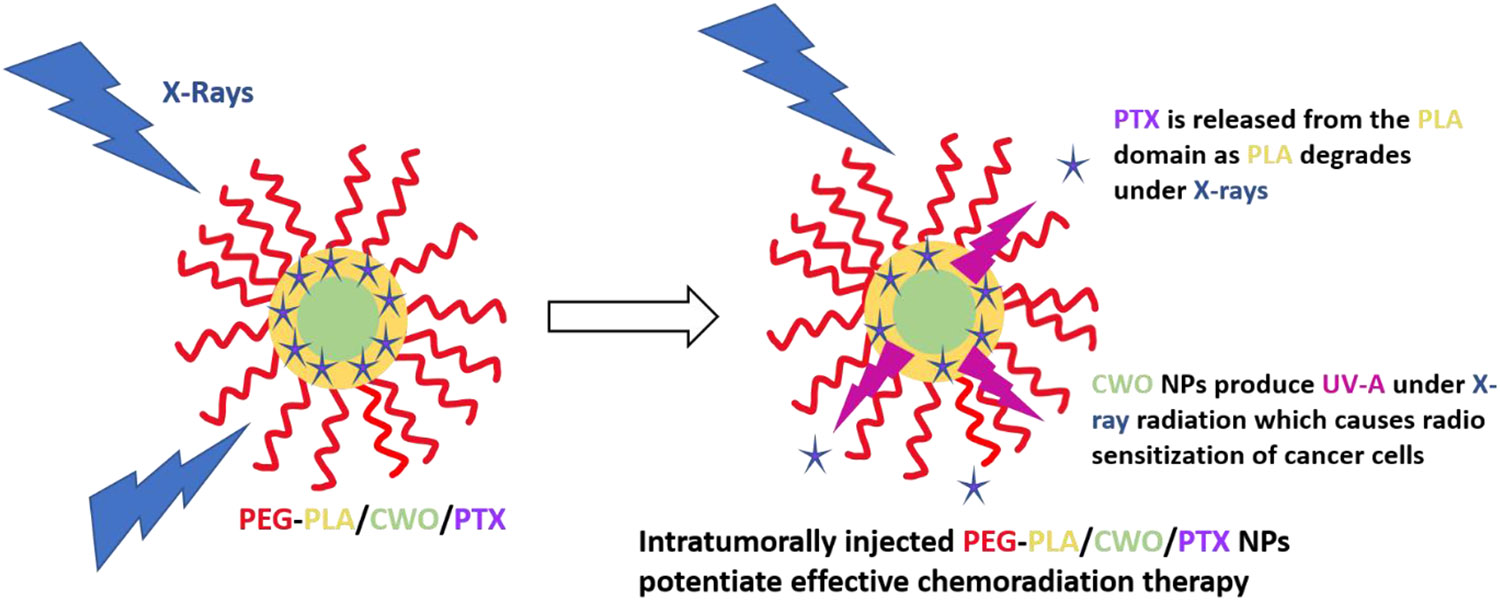
The formulation consists of a CaWO4 (CWO) nanoparticle (NP) core and a poly(ethylene glycol)-poly(D,L-lactic acid) (PEG-PLA) polymer micelle sheath. Chemotherapy drugs, paclitaxel (PTX), are loaded in the hydrophobic domain formed by the PLA blocks. Upon exposure to X-rays, the PEG-PLA coating layer degrades, and the PTX molecules are released from the NP system. The radioluminescent CWO NPs emit UV-A/blue light (350 – 525 nm) under X-ray excitation, which also produces radioenhancement/radiosensitization effects in tumor tissue. Concomitant PEG-PLA/CWO/PTX NPs enhance the effectiveness of chemoradiation for locally advanced tumors.
In the present study, we investigate the effects of PTX stereochemistry on the radiation-triggered PTX release properties and also the in vitro and in vivo therapeutic performance of PEG-PLA/CWO/PTX NPs. This study was initiated by an unexpected discovery of the fact that PTX products from two different manufacturers (“PTX-S” from Samyang Biopharmaceuticals, and “PTX-B” from Biotang) exhibit significantly discrepant radiation-induced release characteristics. Detailed NMR analysis suggests that PTX-S and PTX-B differ in their stereochemical features. This difference in stereochemistry between PTX-S and PTX-B produces a significant difference in their water solubility and thus also in the kinetics of their X-ray-triggered release from the PEG-PLA/CWO/PTX NP formulations; PTX-S is significantly more water-soluble and thus released more rapidly from the carrier. Unencapsulated PTX-S and PTX-B exhibit similar levels of cytotoxicity. However, in both in vitro and in vivo assays, PEG-PLA/CWO/ PTX-S NPs were found to produce greater radio-sensitization effects on short timescales than PEG-PLA/CWO/PTX-B NPs; on the other hand, longer-lasting therapeutic effects were observed for PEG-PLA/CWO/PTX-B NPs, which is consistent with the fact that PTX-B is released slower. To our knowledge, this is the first demonstration of how PTX stereochemistry influences the pharmacokinetic properties of PTX formulations.
2. Experimental Procedures
2.1. Synthesis of Poly(ethylene glycol)-Poly(D,L-lactic acid) (PEG-PLA) and Calcium Tungstate CaWO4 (CWO) Nanoparticles (NPs)
The PEG-PLA block copolymer used in this study was synthesized by ring-opening polymerization of racemic lactide using monomethoxy monohydroxy PEG (mPEG-OH, Mn = 5.0 kDa) as the initiator and 1,8-diazabicyclo[5.4.0]undec-7-ene (DBU) as the catalyst, as described in our previous publications [56-58]; DBU was used (instead of conventional tin catalysts) because DBU enables the room temperature polymerization of LA, producing polymers with much narrower molecular weight distributions due to the absence of transesterification reactions. The number-average molecular weight of the PLA block was determined by 1H-NMR (Figure S1 of the Supporting Information (SI)) to be .
CWO NPs were synthesized using a microemulsion method [53]. Briefly, 0.3 mL of 2 mM sodium tungstate (Na2WO4) in 0.1 M HCl (in Milli-Q-purified water) and 0.2 mL of 2 mM calcium chloride (CaCl2) in Milli-Q water were added to a solution containing 0.364 mg of cetyltrimethylammonium bromide (CTAB) in 10 mL cyclohexane and 1 mL 1-hexanol. The mixture was magnetically stirred for 15 minutes at 60 °C and then transferred into a Teflon-lined autoclave reactor. The reactor was placed in an oven at temperature 160 °C for 24 hours. The reaction product was isolated by centrifugation at 5,000 rpm for 10 minutes and washed 3 times by stirring in 20 mL of ethanol and 2 times by stirring in 20 mL of dichloromethane (DCM) with intermediate centrifugation. 0.25 mg of pristine CWO NPs were dispersed in 1 mL of Milli-Q water, and the suspension was filtered using a 450-nm PTFE filter for TEM analysis (Figure 2A); from TEM images, the mean diameter of the pristine CWO NPs was estimated to be 19.2 nm with a coefficient of variation of 0.1.
Figure 2. TEM micrographs of nanoparticles.
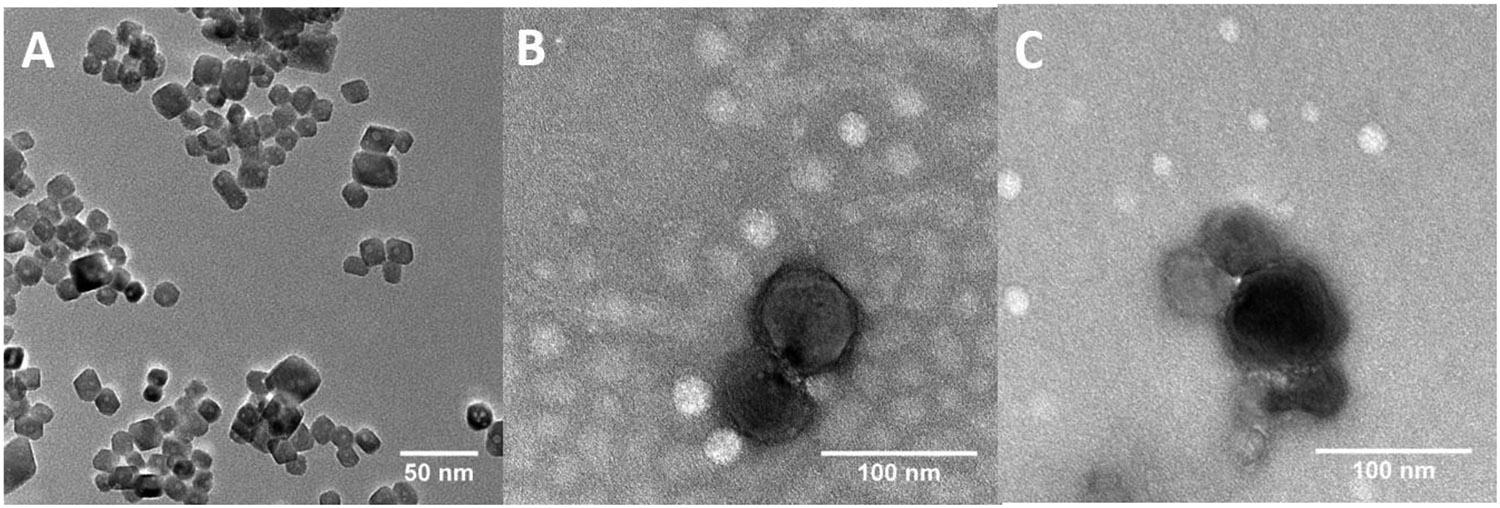
Representative TEM images of (A) uncoated CWO NPs (scale bar: 20 nm), (B) CWO/PEG-PLA/PTX-S NPs prepared using PTX from Samyang (“PTX-S”) (scale bar: 100 nm), and (C) CWO/PEG-PLA/PTX-B NPs prepared using PTX from Biotang (“PTX-B”) (scale bar: 100 nm). A filtered suspension containing pristine/formulated NPs in Milli-Q water was placed on a TEM grid, air dried, and negatively stained with 2% uranyl formate for TEM analysis. The mean diameter of pristine CWO NPs was determined by examining 25 uncoated primary NPs in TEM microscopic fields of view to be 19.2 nm with a coefficient of variation of 0.10.
2.2. Preparation and Characterization of PTX-Loaded PEG-PLA-Encapsulated CWO NPs (“PEG-PLA/CWO/PTX NPs”)
PEG-PLA/CWO/PTX NPs were prepared using a solvent exchange procedure described in our previous publication [50]. PTX compounds were purchased from two different vendors: (i) “PTX-S” manufactured by Samyang Biopharmaceuticals Corp., Inc. (South Korea), and (ii) “PTX-B” purchased from a US distributor, Biotang, Inc. (Lexington, MA) (manufactured by TSZ Chem (China), Catalog #RS036). Briefly, 30 mg of PTX and 300 mg of PEG-PLA were dissolved in 3.9 g of dimethylformamide (DMF, > 99.9% purity, Sigma-Aldrich). 0.5 mg of CWO NPs was then dispersed in 2.1g of Milli-Q water. The two solutions were mixed in a vial. The mixture was agitated using a high-speed disperser at 15,000 rpm under simultaneous ultrasonication for 5 minutes. The final solution was centrifuged at 5,000 rpm for 10 minutes. The supernatant was discarded. The PEG-PLA/CWO/PTX NP pellet was collected. The NP pellet was resuspended in Milli-Q water (for TEM) or phosphate buffered saline (PBS) (for DLS) at a CWO concentration of 0.25 mg/mL, and the suspension was filtered with a 450-nm PTFE filter for TEM (Tecnai F20, FEI) or DLS (ZetaPALS, Brookhaven Instruments) analysis (Figures 2B and S2, respectively). The DLS hydrodynamic diameters (mean ± SE, N = 5) were determined to be 54.5 ± 0.3 nm for filtered PEG-PLA/CWO NPs, 69.9 ± 0.8 nm for filtered PEG-PLA/PTX-S NPs, 71.6 ± 0.6 nm for filtered PEG-PLA/CWO/PTX-S NPs, and 72.2 ± 0.6 nm for filtered PEG-PLA/CWO/PTX-B NPs (Figure S2). The hydrodynamic diameters of unfiltered PEG-PLA/CWO/PTX NPs were 309.2 ± 0.6 nm for PEG-PLA/CWO/PTX-S NPs, and 338.0 ± 0.6 nm for PEG-PLA/CWO/PTX-B NPs. The PEG-PLA:CWO:PTX weight ratios were determined by a combination of thermogravimetric analysis (TGA, organic-to-inorganic mass ratio, Figure S3), atomic absorption spectroscopy (AAS, CWO content) and high performance liquid chromatography (HPLC, PTX content) measurements to be 1.77:1.00:0.56 for unfiltered PEG-PLA/CWO/PTX-S NPs, and 2.44:1.00:0.55 for unfiltered PEG-PLA/CWO/PTX-B NPs. The PTX encapsulation efficiencies were determined by HPLC to be 1.49% for unfiltered PEG-PLA/CWO/PTX-S NPs, and 1.40% for unfiltered PEG-PLA/CWO/PTX-B NPs. The filtration efficiencies were determined by AAS to be 24% for PEG-PLA/CWO/PTX-S NPs, and 27% for PEG-PLA/CWO/PTX-B NPs. See Section 2.4 below for HPLC procedures.
For TGA analysis, PEG-PLA/CWO/PTX NP samples were prepared in the same way as described above, except that the samples were subject to an additional drying step in a benchtop freeze drier (FreeZone 4.5 Plus Cascade Benchtop Freeze Dryer, Labconco). TGA measurements were performed using an SDT-Q600 TGA/DSC instrument (TA Instruments). Weight loss profiles were obtained during heating from room temperature to 1,000 °C at a ramp rate of 4 °C/min in helium environment. PEG-PLA/PTX NP samples were prepared from an initial 9:1 by weight mixure of PEG-PLA and PTX using a procedure similar to that for PEG-PLA/CWO/PTX NP samples.
2.3. Gel Permeation Chromatography (GPC) Analysis of PEG-PLA Polymers after Exposure to X-rays/UV-A Light
0.7 mg of PEG-PLA/CWO NPs, unloaded PEG-PLA NPs (micelles) or butylated hydroxytoluene(BHT)-loaded PEG-PLA/CWO NPs were dissolved in 1.45 mL of PBS. The suspension was exposed to a single 7 Gy dose of X-ray irradiation (XRAD 320, 320 keV, 2.15 Gy/min) or UV-A light (UVP UVGL-15, 365 nm, exposure time = 11 s, source-to-sample distance = 1 cm, UV fluence on sample = 2.8 J/cm2 [50]). Immediately after irradiation, the polymer was recovered from the irradiated solution by liquid-liquid extraction (LLE) as follows. 5 mL of dichloromethane (DCM) was added to the irradiated solution. The mixture was vortexed for 10 minutes and then centrifuged at 5,000 rpm for 30 minutes. The bottom DCM phase was collected and dried in a vacuum oven at room temperature for 8 hours. 0.5 mg of the dried polymer was dissolved in 1 mL of inhibitor-free tetrahydrofuran (THF, HPLC grade, Sigma-Aldrich) and filtered with a 450-nm PTFE filter for GPC analysis. GPC was performed on an Agilent Technologies 1200 Series HPLC system equipped with 3 PLgel 5-μm MIXED-C columns and a Hewlett-Packard G1326A refractive index (RI) detector. Inhibitor-free HPLC-grade THF was used as the mobile phase at 35 °C and a flow rate of 1.0 mL/min. GPC measurement was also performed on the pristine PEG-PLA for comparison.
2.4. Kinetics of Radiation-Triggered PTX Release In Vitro
The kinetics of X-ray-triggered release of PTX from PEG-PLA/CWO/PTX NPs were measured using the following procedure. 2 mL of a 5 mg/mL (based on CWO mass) PEG-PLA/CWO/PTX-S or PEG-PLA/CWO/PTX-B NP suspension in PBS was placed in a dialysis bag (sealed at both ends with clips) with 50 kDa molecular weight cutoff. The dialysis bag was submerged in 100 mL PBS and kept under continuous magnetic stirring at room temperature. The NP solution was irradiated with 2 Gy X-rays (XRAD 320, 320 keV, 2.15 Gy/min) on Day 1. At designated times, the entire dialysis medium was replaced with fresh PBS. The old medium was collected and analyzed by HPLC for determination of the concentration of PTX. PTX was extracted from the dialysis medium by LLE as follows. 50 mL of the medium was mixed with 50 mL of DCM (> 99.5% purity, Sigma-Aldrich) in a separating funnel. The mixture was vigorously stirred for 15 minutes and then kept quiescently for 1 hour until it formed 2 distinct layers. The bottom DCM phase was collected and dried in a vacuum oven at room temperature for 8 hours. The resulting pellet was dissolved in 2 mL of acetonitrile (ACN, HPLC grade, Sigma-Aldrich). The solution was analyzed on an Agilent Technologies 1100 Series HPLC system. The mobile phase was a 1:1 by volume mixture of Milli-Q-purified water and HPLC-grade ACN at a flowrate of 1 mL/min with a C18 column as the stationary phase (5μm, 4 × 125 mm). 10 μL of the solution was injected into the HPLC system. The PTX absorbance was measured at 227.6 nm using a UV detector. A concentration calibration curve was prepared using PTX solutions prepared at different concentrations of PTX in the range 10 – 1,000 μg/mL.
2.5. NMR, Raman Spectroscopy (RS), Circular Dichroism (CD), Adsorption and Water Solubility (WS) Characterizations of the Stereoisomers of PTX, PTX-S and PTX-B
1D 1H NMR spectra were obtained from 2 mg/mL solutions of PTX-S and PTX-B in CDCl3 using a Bruker Advance III HD 400 NMR spectrometer. 2D 1H/13C NMR Heteronuclear Multiple Quantum Coherence (HMQC) and 1H NMR Nuclear Overhauser Effect Spectroscopy (NOESY) measurements were performed on 25 mg/mL solutions of PTX-S and PTX-B in CDCl3 using the same instrument as above. The procedures used for these measurements were taken from Refs. [59, 60] (HMQC) and [60] (NOESY). RS measurements were performed on solid PTX-S and PTX-B films using a ReactRaman 785 Raman spectrometer (Mettler-Toledo). CD spectra were obtained from 0.1 mM solutions of PTX-S and PTX-B in ACN using a Jasco J-1500 CD spectrophotometer. The solution was placed in a quartz cuvette with a path length of 2 mm. The step resolution was 1 nm per point, and the time constant was 1 s. The molar ellipticity was calculated from the measured ellipticity using the equation
| (1) |
where is the molar ellipticity (in millidegree·L·mol−1·cm−1), is the measured ellipticity (in millidegrees), is the molecular weight of the compound (in g/mol), is the path length (in cm), and is the concentration of the compound (in g/L).
Measurement of PTX adsorption to CWO NPs was performed as follows. 0.5 mg of CWO NPs were dispersed in 1 mL of a 0.25 mg/mL PTX solution in DCM. The suspension was centrifuged at 5,000 rpm for 15minutes. The supernatant was collected and dried. The dried pellet was dissolved in 1 mL of ACN, and the concentration of PTX in this solution was determined by HPLC using the procedure described in Section 2.4 above. The WS of PTX was measured as follows. 1 mg of PTX was dispersed in 1 mL of Milli-Q water. The suspension was vortexed and ultrasonicated for equilibration. The suspension was then centrifuged, and the concentration of PTX in the supernatant was determined by HPLC similarly to above.
2.6. Cell Culture
HN31 cells used in this study were obtained from Dr. Jefferey N. Myers’ laboratory at MD Anderson Cancer Center in Houston, TX [61]. Dulbecco’s Modified Eagle Medium (DMEM, Corning) supplemented with 10% v/v fetal bovine serum (HyClone), 0.2% v/v L-glutamine (Gibco), 1% v/v penicillin/streptomycin (Gibco), and 1% v/v HEPES buffer (HyClone) was used as the growth media. All cell culture was performed in an incubator maintained at 37 °C, 5% CO2 and 90% relative humidity. The cells were passaged once they reached 80% confluence. The cell passaging was done as follows. The growth medium was removed. The cells were washed with PBS (Gibco) once. Trypsin (TrypLE Express, 1×) was added to the cells. The cells were incubated with trypsin for 3 minutes in an incubator at 37°C. The detached cells were diluted with growth medium and centrifuged at 300× g for 5 minutes at room temperature. The resultant pellet was re-suspended in 2 mL growth medium. Cell counting was performed using a haemocytometer. The cells were plated in T25 flasks (pretreated with corona discharge/vacuum plasma to assure uniform growth of cells) at 1.0 × 10⁶ cells per flask in growth medium.
2.7. In Vitro Cell Viability (MTT) Assay
The cytotoxicity of unencapsulated PTX-S and PTX-B was evaluated in HN31 cells by the MTT (3-(4,5-dimethylthiazol-2-yl)-2,5-diphenyl-2H-tetrazolium bromide) assay [50]. Briefly, HN31 cells in the exponential growth phase were seeded in a polystyrene-coated 96-well plate at 0.5 × 10⁴ cells per well in growth medium. The cells were allowed to grow for 24 hours in an incubator with 5% CO2 at 37 °C. Prescribed amounts of PTX-S and PTX-B (10 μL of PTX solutions at varying PTX concentrations in a 1:1 by volume mixture of Cremophor-EL and ethanol) were added to individual wells to different final PTX concentrations (in the range of 1 – 100 nM, N = 3 per concentration). After incubation for 48 hours, 10 μL of the MTT reagent (Sigma-Aldrich, 5 mg/mL in PBS) was added to each well. After 4 hours of additional incubation, formazan (formed from MTT in living cells) was extracted from the cells by adding 150 μL of DMSO and mixing for 5 minutes. The absorbance was recorded at 570 nm using a SpectraMax iD3 Multi-Mode Microplate Reader to determine the cell viability after the PTX treatment; the absorbance from a blank well containing growth medium/Cremophor-EL/ethanol/DMSO was used for background subtraction. Wells with cells treated with the drug vehicle (a 1:1 by volume mixture of Cremophor-EL and ethanol) were used as positive control for viability normalization.
2.8. In Vitro Clonogenic Cell Survival Assay
HN31 cells were seeded in 6-well plates at densities of 1 × 10³, 2 × 10³, 4 × 10³ and 8 × 10³ cells per well for 0, 3, 6 and 9 Gy X-ray doses, respectively (N = 3 per dose). Three treatment groups tested are: (1) PEG-PLA/CWO/PTX-S NPs (0.2 mg/mL in growth medium) + X-rays, (2) PEG-PLA/CWO/PTX-B NPs (0.2 mg/mL in growth medium) + X-rays, and (3) PBS (control) + X-rays. After treatment with NPs for 3 hours, the cells were exposed to different (0, 3, 6 and 9 Gy) doses of 320 keV X-rays at a dose rate of 2.15 Gy per minute (XRAD 320, Precision X-Ray). The irradiated cells were cultured for 14 days. Colonies formed by surviving cells were stained with crystal violet dye. Colonies containing > 50 cells were counted as surviving colonies. Survival fraction was determined from the number of colonies per well normalized by unirradiated controls treated with the same NP formulation or PBS.
2.9. HN31 Xenografts in NRG Mice
All mouse work was performed in the Biological Evaluation Shared Resource (BE-SR) facility of the Purdue University Center for Cancer Research (PCCR) under our Purdue Institutional Animal Care and Use Committee (PACUC) Protocol #1112000342. Immune-deficient Non-Obese Diabetic (NOD) Rag Gamma (NRG) mice (female, 6 – 10 weeks old) were housed in standard cages (in groups of 4 per cage) inside a cleanroom facility with free access to food and water and 12-hour automatic light and dark cycles. Mice were acclimated in the facility for 1 week before xenograft implantation. HN31 xenografts were generated by subcutaneously injecting 1.2 million cells in 0.1 mL of serum-free PBS containing 50% v/v Matrigel (BD Bioscience) into the right flank of the mouse. It took about 5 days for the implanted cells to develop into hard tumor tissue.
2.10. In Vivo Pharmacokinetics (PK) of PTX
The PK profiles of the PTX released from PEG-PLA/CWO/PTX NPs after X-ray irradiation were evaluated in mouse HN31 xenografts (NRG mice, female, 5 – 6 weeks old, N = 3 per time point × 7 time points). Briefly, 1.2 × 10⁶ HN31 cells (in 0.1 mL PBS with 50% Matrigel) were implanted into the right flank of each mouse. Once the mean tumor size reached 100 mm3, 100 μL of a 10 mg/mL (based on CWO mass) PEG-PLA/CWO/PTX suspension in PBS was injected into the tumor in 2 equal portions (50 μL per injection) over 2 days (on Days 0 and 1); after the injection, the total intratumoral CWO concentration was 10 mg/cc of tumor at day. Afterwards, mice were given localized 2 Gy irradiation (320 keV, 2.15 Gy/min) of the tumors each day up to 4 days (from Day 1 through Day 4) to a total maximum dose of 8 Gy. Mice were divided into 7 measurement groups: (Group 1) euthanized on Day 0 (before NP injection) (control); (Group 2) euthanized on Day 1 (after NP injection and X-ray irradiation); (Group 3) euthanized on Day 3 (after X-ray irradiation); (Group 4) euthanized on Day 5; (Group 5) euthanized on Day 7; (Group 6) euthanized on Day 15; (Group 7) euthanized on Day 30. Mice in Group 2 received a total of 2 Gy, Group 3 a total of 6 Gy, and the rest a total of 8 Gy (given in fractions of 2 Gy). After euthanasia, tumor, blood, heart, lung, kidney, brain, spleen and liver tissues were collected, weighed and stored. For quantitation of PTX concentration, the tumor tissue was placed in a microtube with micro beads (Precellys) and homogenized using a pulverizer (Precellys). 1 mL of DCM was added to the homogenized tissue (in order to extract PTX). The mixture was kept quiescently for 24 hours. The DCM phase was collected and dried in a vacuum oven at room temperature for 12 hours. The resulting pellet was dissolved in 2 mL of ACN. The solution was analyzed using an Agilent Technologies 1100 Series HPLC system with reversed phase C18 columns. The PTX absorbance at 227.6 nm was measured with a UV detector. The peak area was analyzed to determine the PTX concentration against a standard calibration curve equating concentration with absorbance that was generated using standard solutions with known PTX concentrations in the range between 10 and 1000 μg/mL.
2.11. In Vivo Biodistribution (BD) of PEG-PLA/CWO/PTX NPs
The BD of PEG-PLA/CWO/PTX NPs was evaluated in HN31 tumor-bearing NRG mice following intratumoral (IT) administration. NP/X-ray treatment protocols and sample collection timelines were the same as those for the PK study (Section 2.10). After euthanasia, tumor, heart, lung, kidney, brain, spleen and liver tissues were collected, weighed and dried in an electric oven at 80 °C for 24 hours. The dried tissue was digested in 2 mL of piranha solution (a 1:1 v/v mixture of trace metal-free, concentrated sulfuric acid (98%, Thermo Fischer Scientific) and hydrogen peroxide (Hyclone)) for 7 days. Afterwards, 100 μL of the digested solution was pipetted and diluted with 4.9 mL of Milli-Q-purified water. The solution was filtered with a 0.45 μm PTFE filter and analyzed by AAS (PinAAcle 900T Flame Atomic Absorption Spectrometer, PerkinElmer) to determine the calcium content of the sample. The calcium concentration was determined based on a standard calibration curve.
2.12. In Vivo Tumor Suppression Efficacy of PEG-PLA/CWO/PTX NPs + X-Rays
The radio-sensitization efficacy of PEG-PLA/CWO/PTX NPs was evaluated in a mouse HN31 xenograft model. 1.2 million HN31 cells (with Matrigel) were implanted into the right flank of each mouse. When the mean tumor size was 100 mm3, mice were randomized according to tumor size (N = 8), and NP treatment was started, i.e., 100 μL of a 10 mg/mL PEG-PLA/CWO/PTX NP suspension in PBS was injected into the tumor in 2 portions over 2 days (50 μL each day on Days 0 and 1); the final intratumoral NP concentration was 10 mg/cc of tumor (based on CWO mass). The mice were then given localized tumor exposures to 4 fractionated doses of 2 Gy X-rays (320 keV, 2.15 Gy/min) over 4 days from Day 1 through Day 4 (2 Gy per day times 4 days to a total of 8 Gy). The treatment groups studied are: (1) PBS (vehicle) with no X-rays, (2) PEG-PLA/CWO/PTX NPs with no X-rays, (3) PBS with 8 Gy X-rays, (4) PEG-PLA/CWO/PTX NPs with 8 Gy X-rays. Two experimental endpoints were used to gauge the efficacy of the formulations: (a) tumor size, and (b) mouse survival over time. The tumor sizes were assessed by caliper measurement with the formula V = (4/3) × π × (L/2) × (W/2) × (H/2) at regular intervals. Mouse survival analysis was performed using the standard ICH (International Council for Harmonisation of Technical Requirements for Pharmaceuticals for Human Use) criteria (tumor size > 2,000 cc, or > 20% body weight loss). After euthanasia, tumor tissues and major/excretory organs were collected, weighed and processed for histology analysis.
2.13. Statistical Analysis
All data are presented as mean ± standard deviation, unless specified otherwise. In vitro measurements were performed at minimum in triplicates. Animal numbers were chosen based on statistically relevant results from our previous experiments. Kaplan-Meier analysis was used to compare the unadjusted survival times of mice in different treatment groups; the results were analyzed using the log-rank test (Tables 1 and 2). The PTX water solubility and CaWO4 adsorption data (Figure 7) were analyzed using Student’s t-test. Difference was considered statistically significant if p < 0.05 (*), and highly significant if p < 0.001 (**).
Table 1.
P-values for the Kaplan-Meier survival curves in Figure 14(A) calculated using the log-rank test.
| PBS | PEG-PLA/CWO/PTX-S | PBS + X-Ray | PEG-PLA/CWO/PTX-S + X-Ray | |
|---|---|---|---|---|
| PBS | 0.0084301 | 0.006499 | 0.0010305 | |
| PEG-PLA/CWO/PTX-S | 0.92632 | 0.17629 | ||
| PBS + X-Ray | 0.096434 | |||
| PEG-PLA/CWO/PTX-S + X-Ray |
Table 2.
P-values for the Kaplan-Meier survival curves in Figure 14(B) calculated using the log-rank test.
| PBS | PEG-PLA/CWO/PTX-B | PBS + X-Ray | PEG-PLA/CWO/PTX-B + X-Ray | |
|---|---|---|---|---|
| PBS | 0.20563 | 0.0069303 | 0.0088919 | |
| PEG-PLA/CWO/PTX-B | 0.051758 | 0.070764 | ||
| PBS + X-Ray | 0.40563 | |||
| PEG-PLA/CWO/PTX-B + X-Ray |
Figure 7. Water solubility and affinity of PTX to CWO.
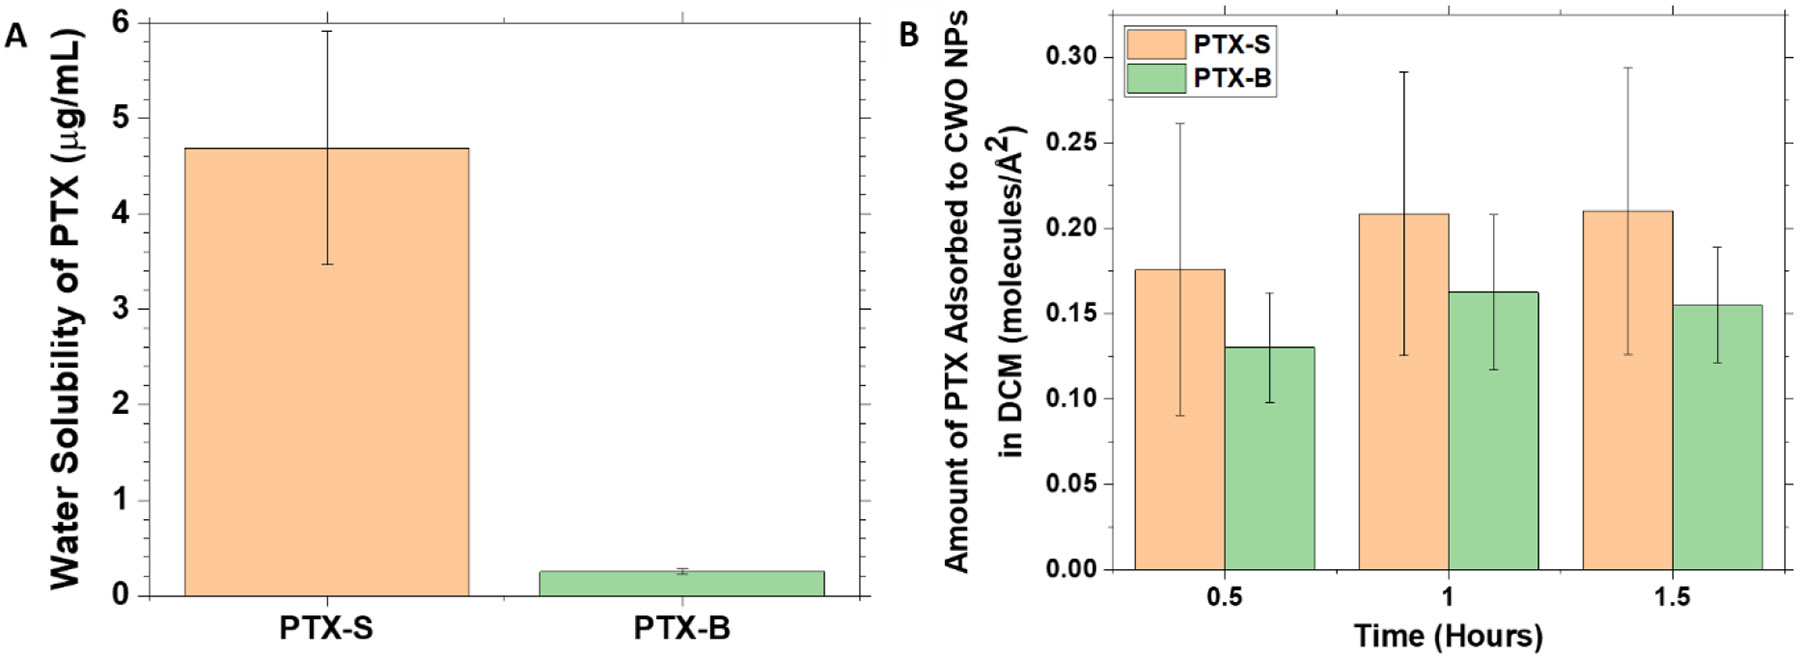
(A) The solubility of PTX in water was determined as follows. 0.1 mL of a 1.0 mg/mL PTX suspension in water was filtered using a 450-nm PVDF filter. PTX was extracted from the filtrate with 0.1 mL of DCM. Upon drying, the extracted PTX was dissolved in 1.0 mL of ACN for HPLC analysis. (B) The amounts of PTX adsorbed to the surface of CWO NPs in DCM were determined as follows. 50 μL solutions containing 10 mg/mL of CWO NPs (19.2 nm mean diameter) and 0.25 mg/mL of PTX in DCM were prepared. At different time points, the solution was centrifuged at 5,000x g for 10 minutes, and the supernatant was collected. The supernatant solution was dried under vacuum, and the pellet was re-dissolved in 1 mL of ACN for determination of PTX concentration in the supernatant by HPLC. All data represent mean ± standard deviation (N = 3).
3. Results and Discussion
3.1. Mechanism of X-ray-induced degradation of PEG-PLA in PEG-PLA/CWO NPs
Previously, we have demonstrated that the X-ray-triggered release of PTX from PEG-PLA/CWO/PTX NPs is primarily due to the photolytic degradation of the PLA polymer caused by X-ray/UV-A radiation, whereas the photocatalytic effects of CWO NPs (10 nm diameter) were not clearly distinguishable [50]. A similar characterization was performed since different sized CWO NPs (19 nm diameter) were used in the present study; polymers were analyzed by GPC after exposure to X-rays (320 keV, 7 Gy) or UV-A (365 nm, 0.56 J/cm2, equivalent 365 nm UV-A fluence generated by PEG-PLA/CWO NPs (of similar size/crystallinity characteristics) under 7 Gy 320 keV X-ray radiation [55]) in the presence or absence of loaded CWO NPs. As shown in Figure 3(A), the results indicate that (i) (although the polymer degrades under X-ray irradiation regardless of CaWO4) the presence of CaWO4 significantly enhances the degradation of the polymer, (ii) (while primary UV-A light only causes slight degradation of the polymer in the absence of CaWO4) the UV-A + CaWO4 combination causes a significantly greater level of degradation of the polymer, and (iii) (although both X-rays and UV-A are able to cause the polymer degradation in the presence of CaWO4) X-ray radiation is far more effective at causing the degradation than UV-A. In the present study, we also performed additional experiments to evaluate the roles of water in the radiation-induced degradation of PEG-PLA; PLA is known to absorb water up to about 1% of its own dry weight [62]. As shown in Figure 3(B), when the polymer was exposed to X-ray or UV-A radiation in the dried state (air-dried for > 12 h) regardless of whether it was in the presence or absence of loaded CaWO4, the radiation did not cause any degradation of the polymer (even in the presence of CaWO4), suggesting that the PEG-PLA degradation is mediated by hydroxyl radicals generated via UV-A/radiolysis of water; the radicals are more efficiently generated under the photocatalytic influence of CaWO4. Similar experiments were also performed in the presence of a free radical scavenger, butylated hydroxytoluene (BHT), loaded in the hydrophobic PLA domain of the micelle core. As shown in Figure 3(C), BHT significantly suppressed the polymer degradation reaction, which suggests that free radicals (reactive oxygen species) are indeed mediators of the radiation-induced PEG-PLA degradation process.
Figure 3. GPC analysis of irradiated PEG-PLA.
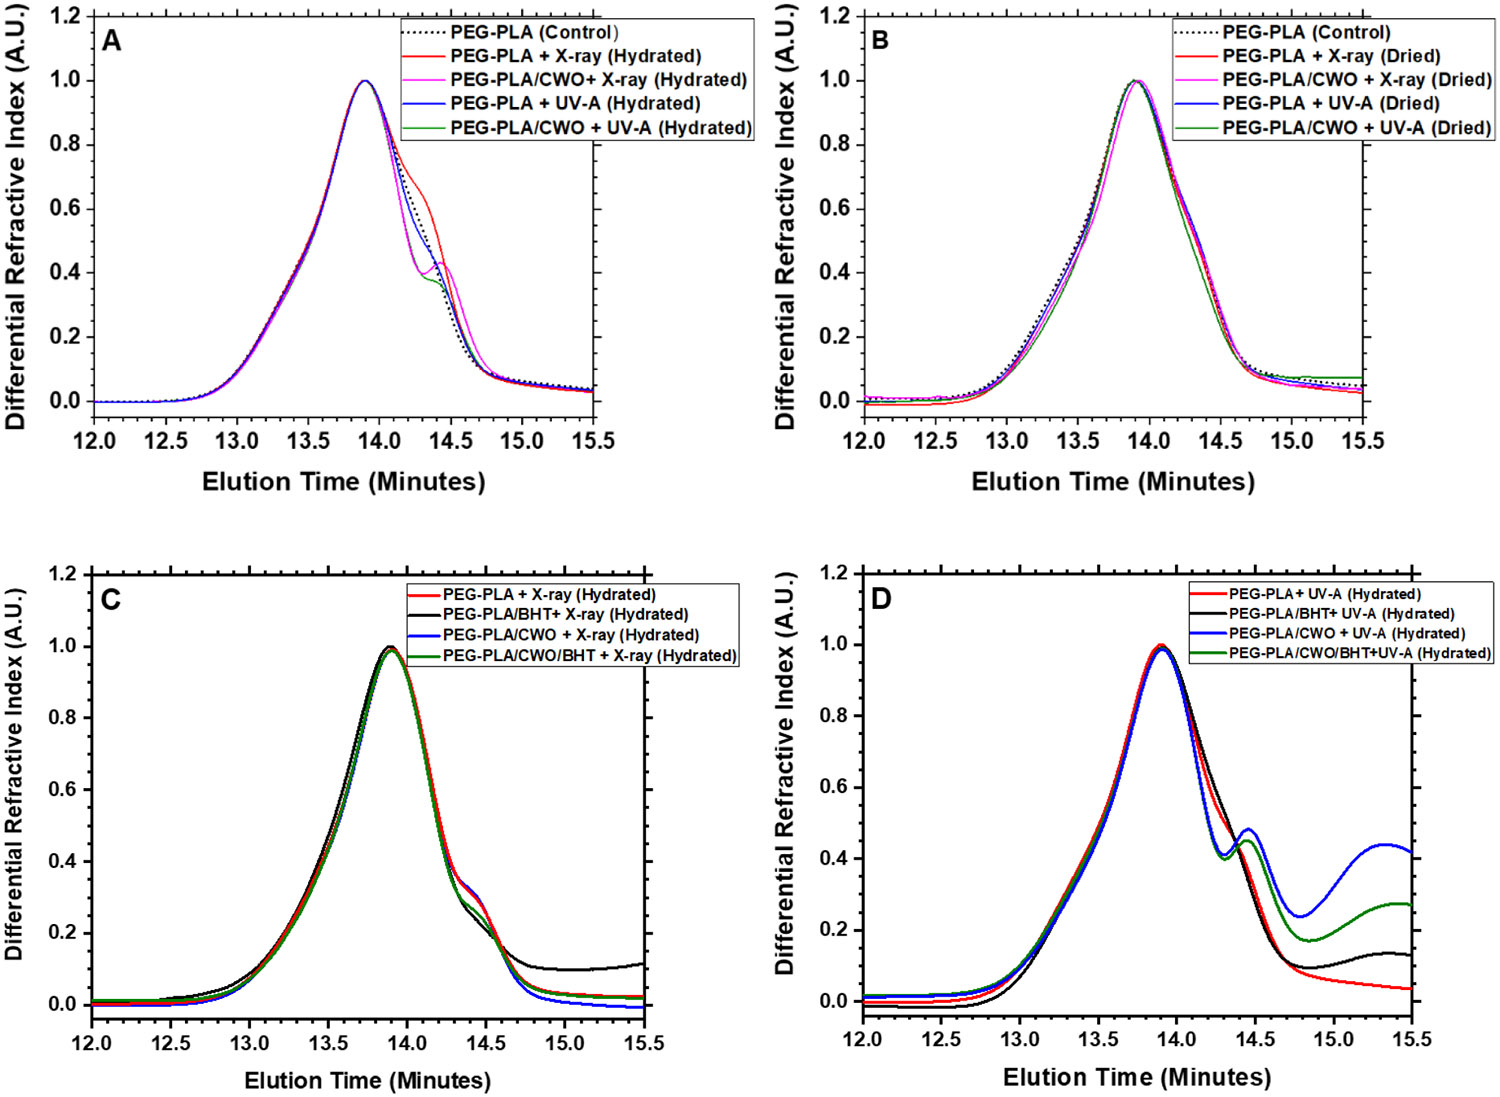
GPC traces for PEG-PLA re-extracted from PEG-PLA micelles or PEG-PLA/CWO NPs exposed to X-rays or UV-A light in the (A) hydrated or (B) dried state in the absence or (C, D) presence of a free radical scavenger, butylated hydroxytoluene (BHT), co-loaded in the PLA domain. PEG-PLA micelles and PEG-PLA/CWO NPs were suspended in PBS at a concentration of 0.15 mg/mL (based on mass of PEG-PLA for PEG-PLA micelles and based on mass of CWO for PEG-PLA/CWO NPs) (“hydrated” samples). “Dried” samples were prepared by air-drying the hydrated samples. PEG-PLA micelles and PEG-PLA/CWO NPs were irradiated with 365-nm UV-A at a total fluence of 0.56 J/cm2 or 320-keV X-rays at a total dose of 7 Gy; the dried sample was re-dissolved in dichloromethane (DCM) after the irradiation. PEG-PLA was extracted from the irradiated solutions via liquid-liquid extraction with DCM. The extract was dried, and the polymer residue was dissolved in tetrahydrofuran (THF) for GPC analysis.
3.2. Effects of the stereochemical structure of PTX on the physicochemical properties of PTX and the in vitro pharmacological properties of PEG-PLA/CWO/PTX NPs
At the outset, we would like to note that the present study was initiated by an observation of an unexpected difference in the radiation-controlled release properties between PTX compounds from two different suppliers, PTX from Samyang Biopharmaceuticals Corp., Inc. (“PTX-S”) vs. PTX from Biotang, Inc. (“PTX-B”); see Figure 6. This section discusses findings of this research arranged in a logical sequence, not in a chronological timeline. Also of note, all data reported in our previous publication [50] were obtained using PTX-S.
Figure 6. 2D heteronuclear 1H and 13C NMR spectroscopy for stereochemistry determination.
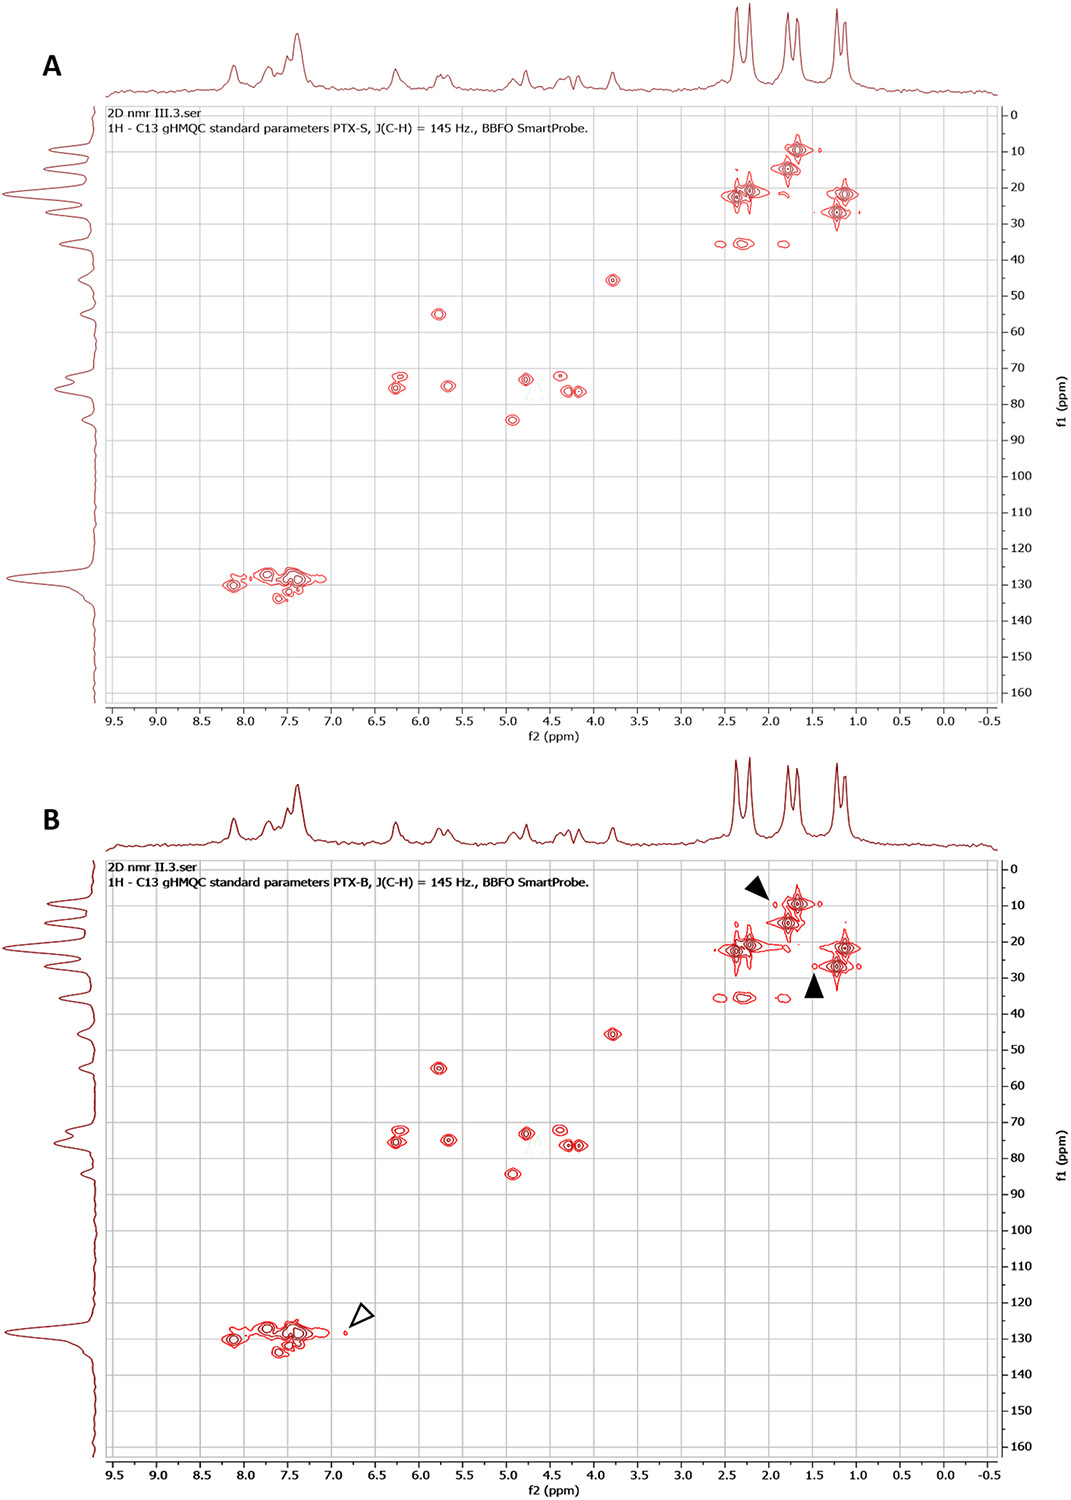
HMQC spectra for (A) PTX-S and (B) PTX-B. NOESY spectra for (C) PTX-S and (D) PTX-B. Data were obtained from 25 mg/mL PTX/CDCl3 solutions using a Bruker AV-III-400-HD NMR spectrometer. Arrow heads indicate distinct signals between PTX-S and PTX-B.
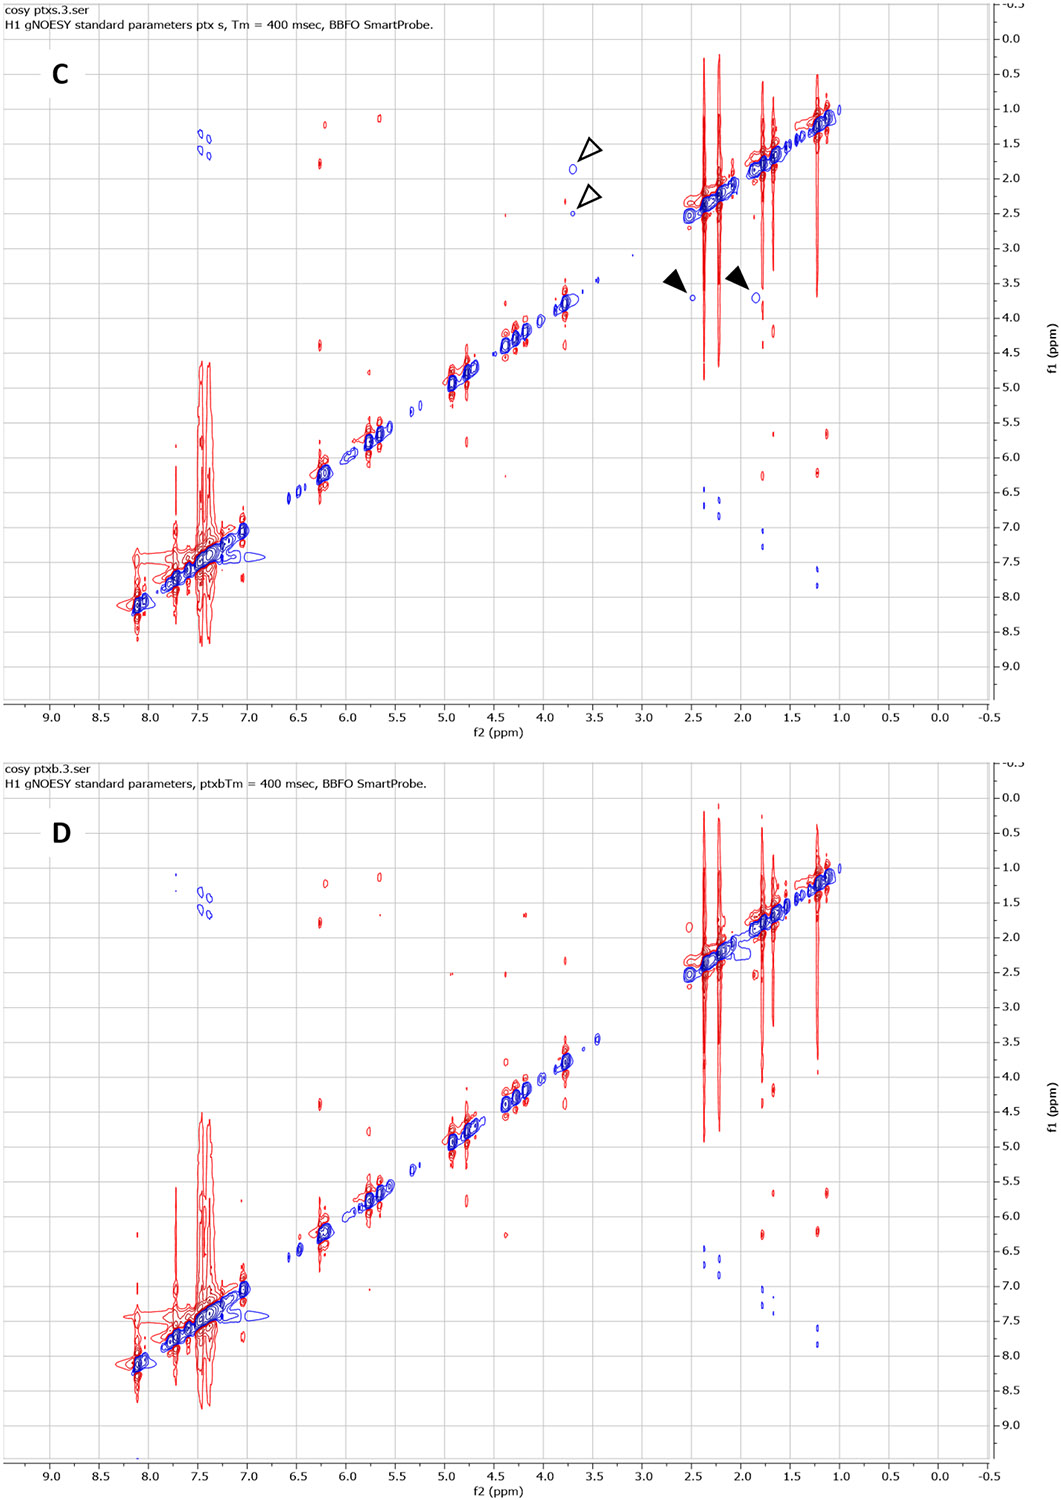
The stereochemical properties of PTX-S and PTX-B were investigated. First, PTX-S and PTX-B were analyzed by 1H NMR spectroscopy (2 mg/mL PTX in CDCl3). As shown in Figure 4(A), no difference in chemical shifts was observed, confirming that the two compounds are chemically identical. Next, Raman spectroscopy (RS) measurements were performed on solid PTX films, because RS is known to be sensitive to stereochemistry [63]. As shown in Figure 4(B), some differences in Raman band intensities were observed at 1700 cm−1 (corresponding to C=O stretching) and 1000 cm−1 (corresponding to C-O stretching) [64]. Differences in Raman shifts observed in the wavenumber range between about 900 and 800 cm−1 signified an out-of-plane C-H deformation of a benzene ring [64]. These data indeed suggested the possibility of some differences in stereochemistry between PTX-S and PTX-B; as shown in Figure 5, there are 11 chiral carbon centers in PTX (marked with stars). To further test the existence of a stereochemical difference, circular dichroism (CD) spectroscopy was used; the CD spectra for PTX-S and PTX-B are displayed in Figure 4(C) (0.1 mM PTX in acetonitrile (ACN)). The CD spectra of PTX in ACN generally consisted of two broad bands, a positive band centered around 240 nm, and a negative band around 300 nm. The positive band corresponds to the n-π* transition of a C=O group, and the negative band corresponds to the π-π* transition of a side-chain aromatic ring [65]. As shown in Figure 4(C), significant differences in CD spectra were observed between PTX-S and PTX-B. Relatively, PTX-B exhibited a sharper positive peak at 240 nm and a smaller shoulder on the negative band at around 264 nm. All these data strongly suggested that there exists a difference in secondary structure between PTX-S and PTX-B, which, in turn, can generate a difference in hydrophilic/hydrophobic character of the molecule.
Figure 4. Comparison between Samyang PTX (PTX-S) and Biotang PTX (PTX-B).
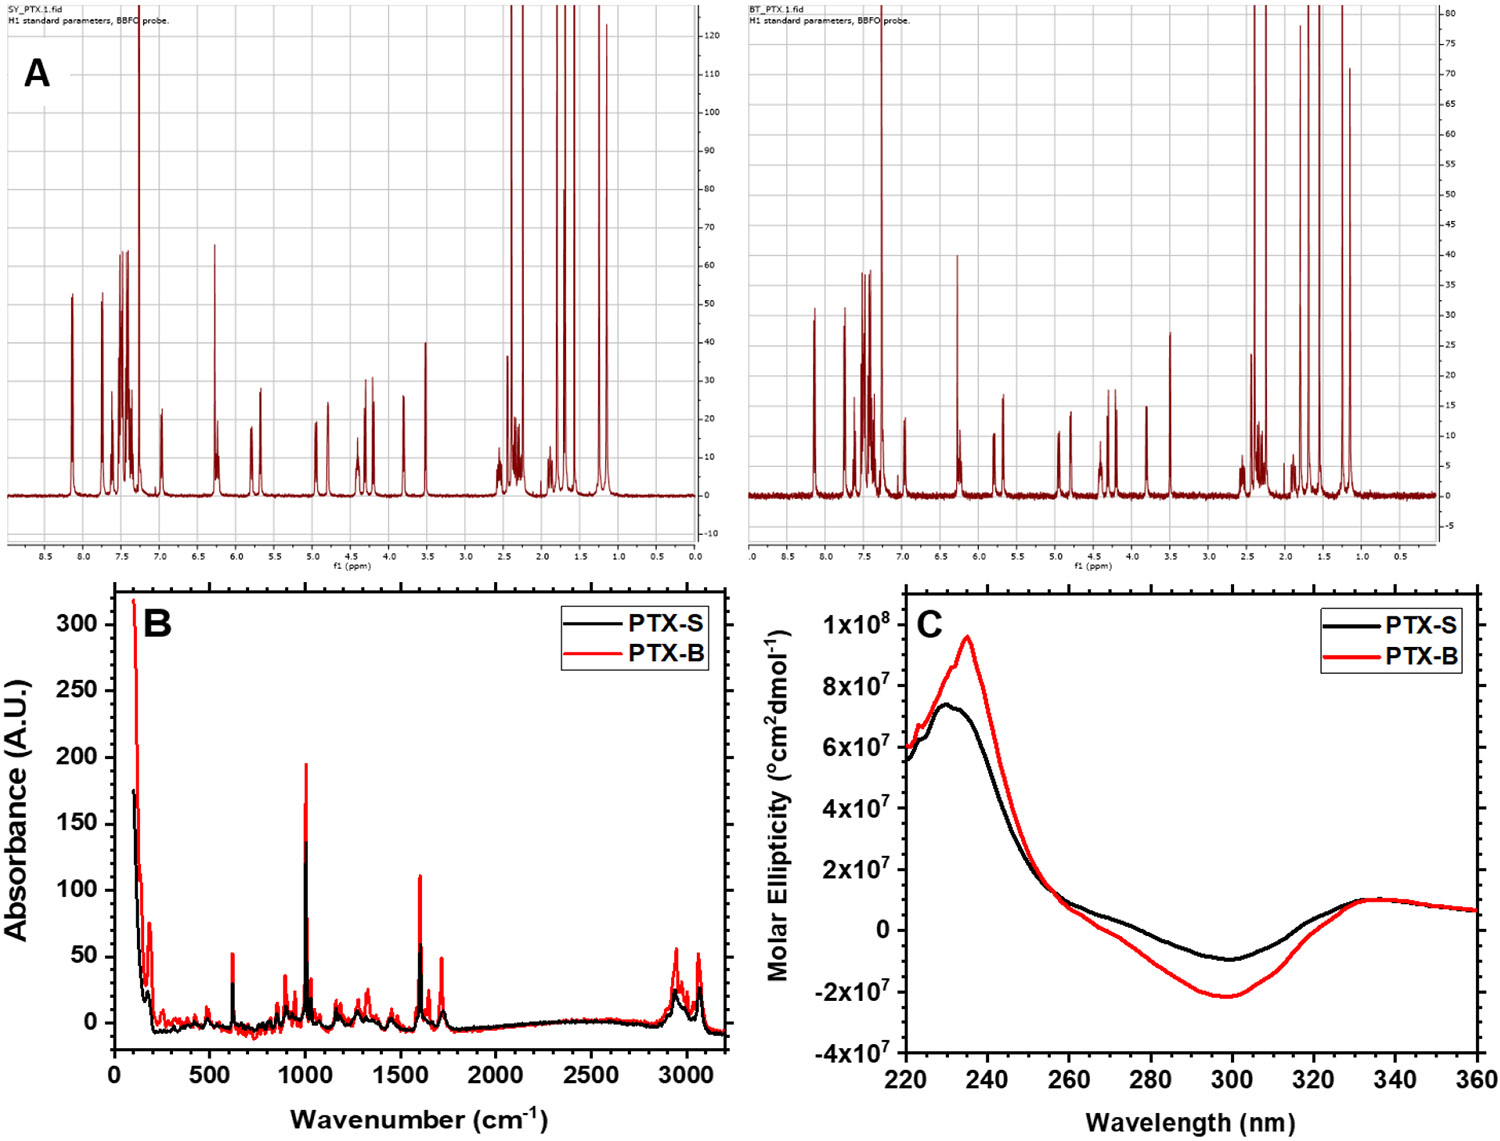
(A) 1H NMR spectra for PTX-S (left) and PTX-B (right) in CDCl3. (B) Raman absorbances for PTX-S and PTX-B in the dry state. Data were obtained using a ReactRaman 785 spectrometer. (C) Circular dichroism (CD) spectra for PTX-S and PTX-B. 0.1 mM PTX/acetonitrile solutions were analyzed using a Jasco-1500 CD spectrophotometer to measure the molar ellipticity of PTX as a function of wavelength.
Figure 5. The structural formula of PTX.
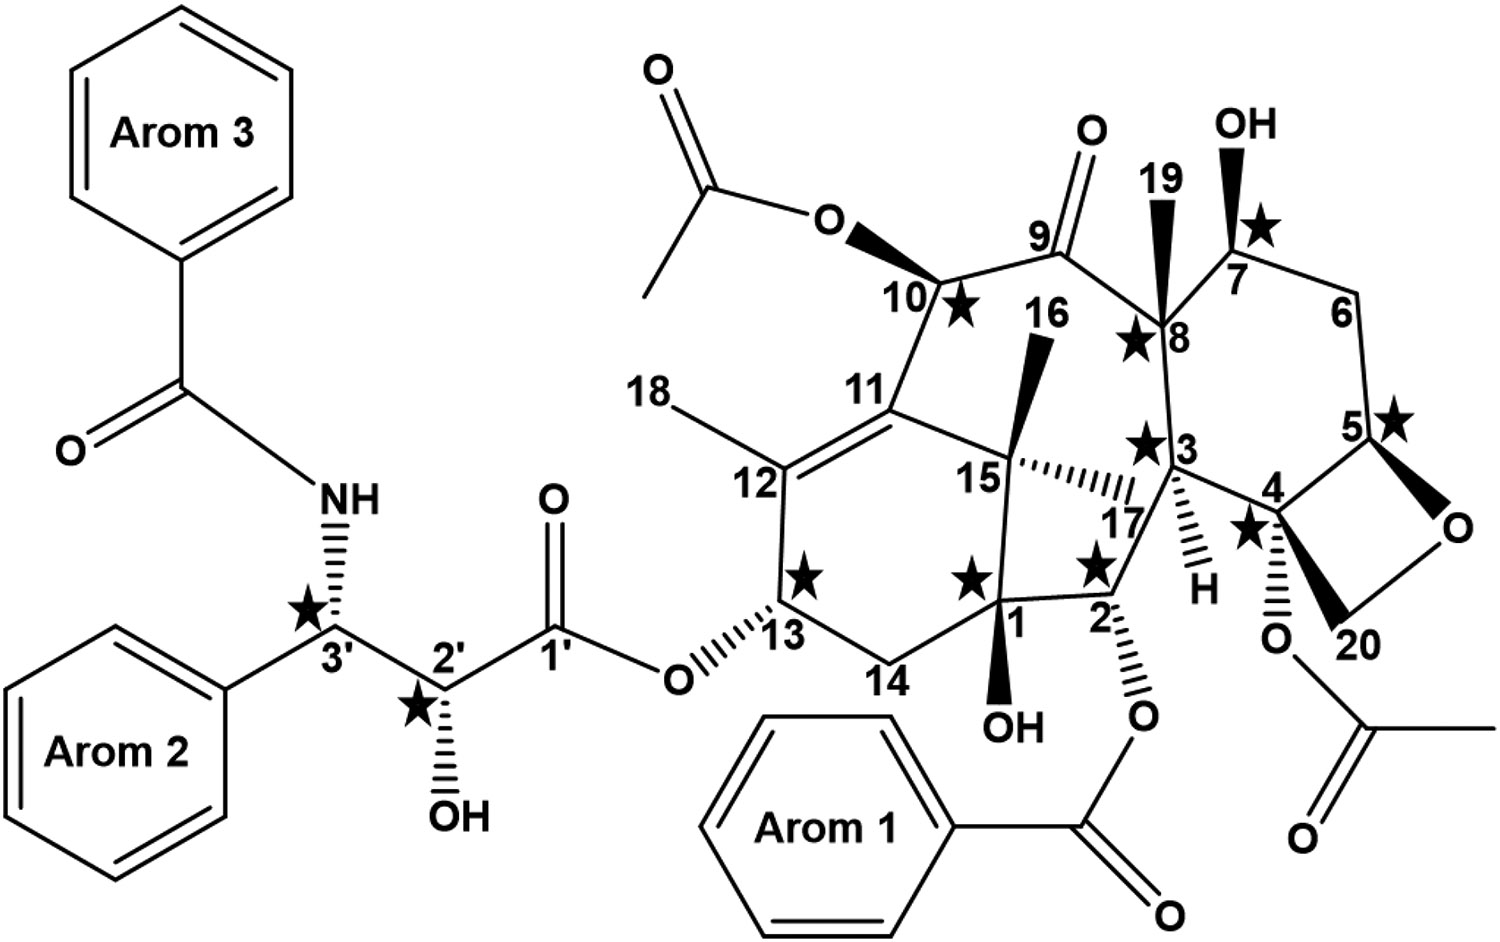
There are 11 chiral centers in PTX (marked with five-pointed stars).
As shown in Figure 5, there are total 11 chiral centers in PTX. In order to characterize the exact locations of chiral carbon centers at which the stereochemical differences occur, two-dimensional (2D) 1H-13C Heteronuclear Multiple Quantum Coherence (HMQC) NMR spectroscopy measurements were performed (25 mg/mL PTX in CDCl3). The results are presented in Figures 6(A) (PTX-S) and 6(B) (PTX-B). As can be seen from these figures, significant differences in chemical shifts were observed at two locations (marked with filled arrowheads in Figure 6(B)). First, a difference was seen in chemical shifts centered around at a 13C shift (“f1”) of 26.9 ppm and a 1H shift (“f2”) of 1.24 ppm, which correspond to the C17 methyl group [59]; here, the carbon center numbers (e.g., “C17”) are as defined in Figure 5. The spectra associated with this C17 methyl group must be influenced by the orientation of the OH group attached to C1 (and thus the chirality of C1). A difference in spectra was also observed in chemical shifts centered around at a 13C shift (“f1”) of 9.50 ppm and a 1H shift (“f2”) of 1.68 ppm, which correspond to the C19 methyl group [59]. The spectra associated with this C19 methyl group must be influenced by the orientation of the OH group attached to C7 (and thus the chiralities of C8 and C7). However, the chemical shifts associated with the C-H bond on C7 (at f1 ≅ 72.2 ppm and f2 ≅ 4.40 ppm) were identical between PTX-S and PTX-B, which allowed us to exclude any difference in the chirality of C7. Therefore, the HMQC NMR data suggest that differences in stereochemistry likely occur at C1 and/or C8. These results are consistent with the RS results; the difference in the vibrational mode of C=O stretching (at 1700 cm−1) is likely because the C=O group on C9 is influenced by the orientation of the -CH3 group attached to C8, and the difference in the absorption mode of C-O stretching (at 1000 cm−1) is likely due to different orientations of the -OH group attached to C1. The chiral properties of C1 and C8 affect the electron distributions in nearby C=O and aromatic residues, which also explains the CD results discussed above. We note that there exists another difference in broad signals centered around at f1 ≅ 128 ppm and f2 ≅ 7.5 ppm (marked with an open arrowhead in Figure 6(B)), which correspond to aromatic groups [59]. It is difficult to pinpoint the exact origin of this difference because there are 3 aromatic rings in PTX. Nevertheless, this difference also appears to be in agreement with the CD results discussed above.
2D NMR Nuclear Overhauser Effect Spectroscopy (NOESY) is also known to be able to detect stereochemical differences. NOESY measurements were performed to further validate the locations of stereochemical differences between PTX-S and PTX-B (25 mg/mL PTX in CDCl3). The results are presented in Figures 6(C) (PTX-S) and 6(D) (PTX-B); the blue and red colors signify positive and negative NOE correlations, respectively. As can be seen from these figures, differences in NOE interactions (internuclear dipolar couplings) were visible at two different locations. As shown in Figure 6(C) (marked with filled arrowheads), in the case of PTX-S, an “irradiation” of the proton of C3 (f1 ≅ 3.79 ppm [59]) produced “illuminations” of the proton of the OH group attached to C1 (f2 ≅ 1.80 ppm, which, of note, does not exactly coincide with the value (1.98 ppm) reported in Ref. [59] likely because of the sensitivity of the OH chemical shift to moisture content) and, to a weaker extent, of the proton of the OH group attached to C7 (f2 ≅ 2.48 ppm [59]). These NOE interactions were symmetric; the conjugate NOESY signals are also marked with open arrowheads in Figure 6(C). The same effects were not seen with PTX-B (Figure 6(D)). Taken together, the combined results of the RS, CD, HMQC and NOESY measurements suggest that C1 is the most likely location where the difference in stereochemistry between PTX-S and PTX-B takes place. The exact cause of this difference is unclear; different manufacturing processes must have contributed to this difference.
We investigated whether this difference in stereochemistry results in any difference in physicochemical properties of PTX, such as water solubility and affinity to CaWO4. Water solubility is an important parameter that affects the release kinetics of a drug from a delivery system [17, 66]. The water solubilities of PTX-S and PTX-B were measured at room temperature by HPLC. As shown in Figure 7(A), a significant difference was found; PTX-S has a water solubility of 4.69 ± 1.22 μg/mL (5.49 ± 1.43 μM), whereas PTX-B has a much smaller water solubility of 0.25 ± 0.03 μg/mL (0.29 ± 0.04 μM). Literature values of the solubility of PTX in pure water vary over a considerable range (0.3 – 30 μg/mL [17]); we suspect that differences in stereochemistry might have played a role in this variation. As will be demonstrated, the water solubility of PTX indeed significantly impacts the in vitro and in vivo pharmacokinetic properties of PEG-PLA/CWO/PTX NP formulations.
We also tested whether the difference in stereochemistry affects the way PTX interacts with CaWO4. The amounts of PTX adsorbed to CWO NP surfaces were measured as a function of time in solutions containing 0.25 mg/mL of PTX and 0.5 mg/mL of CWO NPs in DCM at room temperature (by HPLC analysis of supernatant samples). The results are presented in Figure 7(B). As shown in the figure, in both PTX-S and PTX-B cases, the adsorption reached equilibrium in < 0.5 h, and the areas occupied by a PTX molecule on the CWO NP surface were measured to be 43.8 ± 3.5 Å2/molecule for PTX-S and 33.0 ± 3.1 Å2/molecule for PTX-B; considering that the topological polar surface area of PTX is known to be about 221 Å2 [67], these surface coverage values suggest that the adsorbed PTX-S and PTX-B molecules likely assume an edge-on orientation. Most importantly, we found no significant difference in the amount adsorbed to the CaWO4 surface between PTX-S and PTX-B; therefore, the stereochemistry of PTX does not appear to significantly influence its affinity to CWO NP surfaces.
The cytotoxicities of unformulated PTX-S and PTX-B were evaluated by MTT assays against p53-mutant human head and neck cancer HN31 cells in vitro; HN31 cells were exposed to various doses of PTX-S and PTX-B in the range of 0 – 100 nM (<< their solubility limits in water) delivered using a 10:1 by volume mixture of water and DMSO as the vehicle for 48 h, and afterwards the viabilities of these treated cells were determined by the MTT assay. As shown in Figure 8, PTX-B showed slightly higher cell-killing potencies compared with PTX-S at all (but one) concentrations tested; the IC50 values were estimated to be 9.0 ± 1.5 nM for PTX-S and 16.8 ± 3.4 nM for PTX-B. However, these differences were not statistically significant. Overall, free PTX-S and PTX-B molecules appear to be comparable in their biological activity (i.e., in their interactions with tubulin subunits [10]).
Figure 8. In vitro MTT cell viability assays.
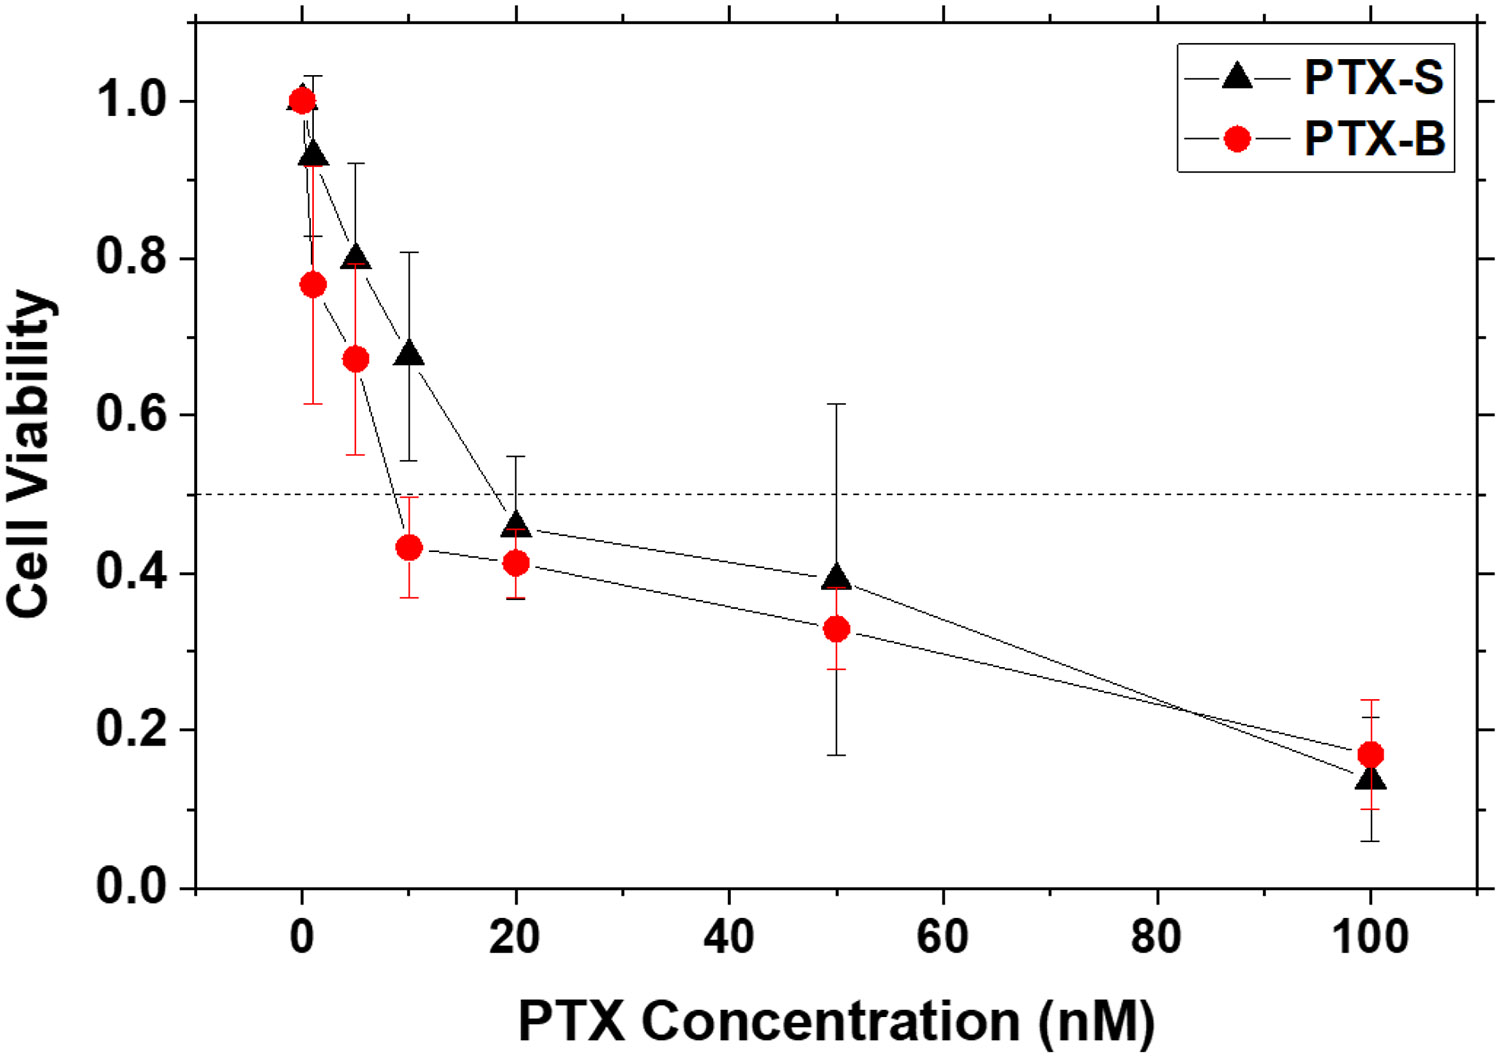
HN31 cells in the exponential growth phase were seeded in a 96-well plate at a density of 0.5 x 10⁴ cells per well. After a 24-hour incubation period, the cells were exposed to different concentrations of PTX-S and PTX-B (in the range of 1 – 100 nM) (N = 3 per group); 20 μL of a PTX suspension in Cremophor-EL at an appropriate PTX concentration was added to each well containing 80 μL of culture medium; the viability measured with addition of 20 μL of pure Cremophor-EL was used as the normalization reference. After 48 hours of exposure to PTX, 10 μL of MTT reagent was added to each well. The cells were further incubated for 4 hours and then treated with 150 μL of DMSO. Afterwards, absorbances at 570 nm were measured using a SpectraMax iD3 Multi-Mode Microplate Reader. Error bars represent standard deviations. The horizontal dotted line at 50% viability is a guide to the eye.
PEG-PLA nanoparticles co-loaded with CaWO4 and PTX (“PEG-PLA/CWO/PTX NPs”) were prepared by solvent exchange (as described in Section 2.2). As shown in Figure S2, the mean hydrodynamic diameters of unfiltered PEG-PLA/CWO/PTX-S and PEG-PLA/CWO/PTX-B NPs were measured (by DLS) to be 309.2 ± 0.6 and 338.0 ± 0.6 nm, respectively. In the final unfiltered PEG-PLA/CWO/PTX NP formulations containing 10 mg/mL of CWO NPs in Milli-Q water (CWO concentrations determined by AAS), the PTX loading ratios ( defined as the mass of PTX divided by the mass of PEG-PLA/CWO/PTX) were 16.8% for PTX-S and 13.8% for PTX-B (determined by TGA, AAS and HPLC). The kinetics of X-ray-triggered release of PTX-S and PTX-B from their respective encapsulated formulations were investigated. 2 mL each of 5 mg/mL PEG-PLA/CWO/PTX-S and PEG-PLA/CWO/PTX-B NPs in Milli-Q water (NP concentration based on CWO mass) was placed in a 50-kDa dialysis bag (made from regenerated cellulose), and the dialysis bag was suspended in a flask containing 100 mL of PBS under continuous magnetic stirring. The NP samples were irradiated with 2 Gy of 320 keV X-rays (2.15 Gy/min) at day. At regular time intervals, the entire volume of PBS was removed for analysis and replaced with 100 mL of fresh PBS. PTX was extracted from the PBS medium (50 mL) using DCM (50 mL), dried, re-dissolved in ACN (2 mL), and its amount quantitated by HPLC. The cumulative amounts of released PTX-S and PTX-B thus determined at various time points are given in Figure 9. As shown in the figure, both PTX-S and PTX-B were rapidly released during the first 4 – 5 days, and this rapid release phase was followed by a slower phase. During this second release phase, PTX-S and PTX-B showed markedly different release profiles; much larger amounts of PTX-S were released than PTX-B. At Day 12, for instance, the cumulative percentage of PTX released was about 34% for PEG-PLA/CWO/PTX-S NPs, while it was only about 24% for PEG-PLA/CWO/PTX-B NPs. These results clearly indicate that the difference in stereochemistry, and thus in water solubility, between PTX-S and PTX-B produces a significant difference in the kinetics of their release from the experimental formulations triggered by X-ray irradiation; PTX-S is released into the aqueous phase much faster, because it has a higher water solubility.
Figure 9. PTX release profiles.
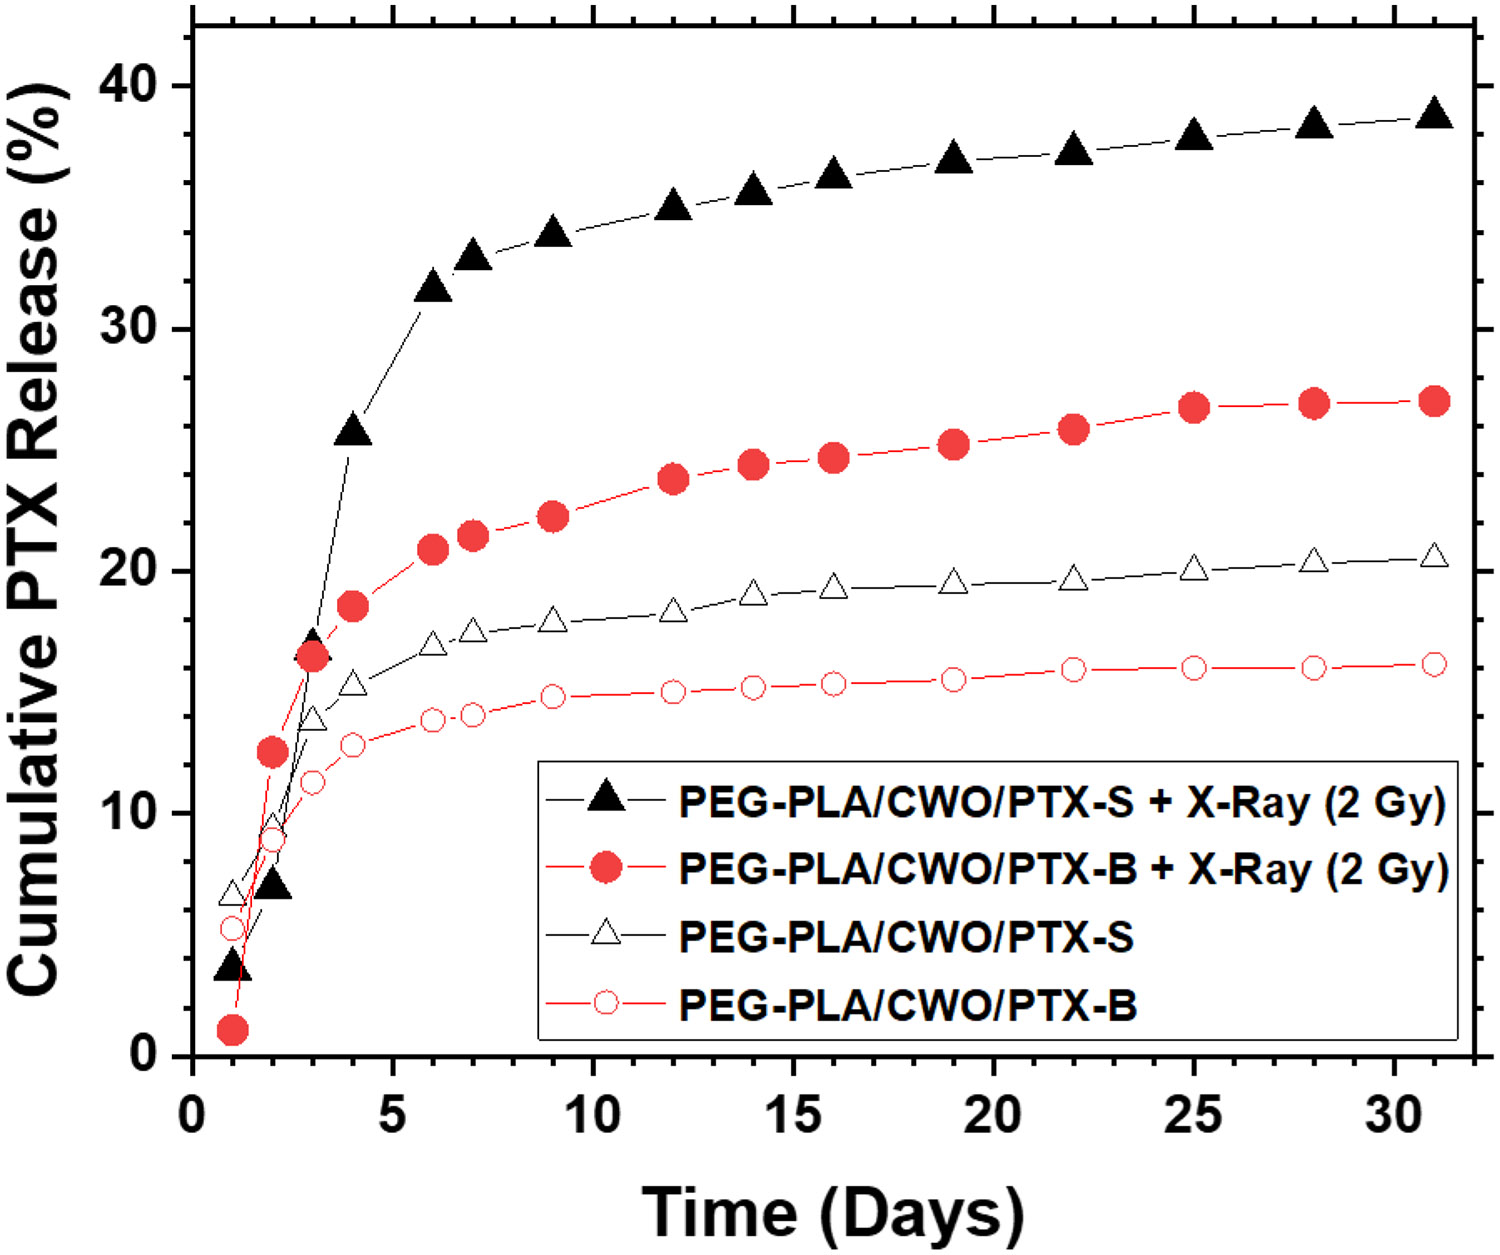
2.0 mL of a 5 mg/mL (based on CWO mass) PEG-PLA/CWO/PTX NP suspension in PBS was placed in a 50 kDa MWCO dialysis bag. The dialysis bag was placed in a beaker containing 100 mL of PBS media under magnetic stirring. The whole dialysis system (i.e., the PEG-PLA/CWO/PTX NP suspension and the release medium) was irradiated with 2 Gy of 320-keV X-rays (2.13 Gy/min) on Day 1. At regular time intervals, 100 mL of the bulk medium was taken out, and the identical volume of fresh PBS was added to maintain constant volume for the medium. PTX was extracted from 50 mL of the time sample with 50 mL of DCM, vacuum dried overnight, and re-dissolved in 2 mL of acetonitrile (ACN) for quantitation by HPLC. Note: Unfiltered nanoparticles were used for this study.
The clonogenic survival of HN31 cells was evaluated after X-ray irradiation with concurrent PEG-PLA/CWO/PTX-S or PEG-PLA/CWO/PTX-B NPs in vitro. HN31 cells were treated with PTX-S or PTX-B-loaded nanoparticles for 3 hours and then irradiated with 4 different X-ray doses (0, 3, 6 and 9 Gy, 320 keV, 2.15 Gy/min) in the presence of those nanoparticles. The cells were incubated with the nanoparticles for additional 24 h after the radiation treatment and then washed with fresh medium to remove the nanoparticles from the culture. The clonogenic survival of the cells was assessed at 14 days post radiation compared to irradiated controls (i.e., cells irradiated without nanoparticles). The results are presented in Figure 10. The survival fraction () vs. radiation dose () data were quantitatively analyzed by fitting to the linear quadratic model
| (2) |
where and are fitting parameters. As summarized at the bottom of Figure 10, the ratio (a measure of low dose sensitivity [50]) was increased from 10.9 for radiation to 33.1 for PEG-PLA/CWO/PTX-S NPs and to 37.3 for PEG-PLA/CWO/PTX-B NPs, which supports that PEG-PLA/CWO/PTX NPs are indeed capable of producing radio-sensitization effects. The sensitization enhancement ratios ((at without NPs)/(at with NPs) were estimated to be 1.73 for PEG-PLA/CWO/PTX-S NPs and 2.00 for PEG-PLA/CWO/PTX-B NPs. Note the above SER value for PEG-PLA/CWO/PTX-S NPs is higher than what has been reported for a similar system in our previous publication (); this discrepancy was likely caused by a higher PTX loading ratio ( defined as the mass of PTX divided by the mass of PEG-PLA/CWO/PTX) used in the present study () than that used in the previous work () [50]. Overall, as can be seen from Figure 10, both PEG-PLA/CWO/PTX-S and PEG-PLA/CWO/PTX-B NP formulations produced significant enhancement of cancer cell kill relative to radiation only, and the radio-sensitization effect of the PTX-B-loaded system appeared to be consistently slightly greater than that of the PTX-S-loaded system, although their difference was statistically insignificant. These results are very consistent with other results, i.e., the slightly lower IC50 value of unformulated PTX-B (Figure 8), and also the comparable kinetics of X-ray-triggered release between PTX-S and PTX-B from their respective encapsulated formulations during the first few days post irradiation (Figure 9). However, the difference in the longer-term release kinetics between PTX-S and PTX-B (Figure 9) becomes a differentiating factor for their in vivo efficacy, as will be discussed in the next subsection.
Figure 10. In vitro clonogenic cell survival assays.
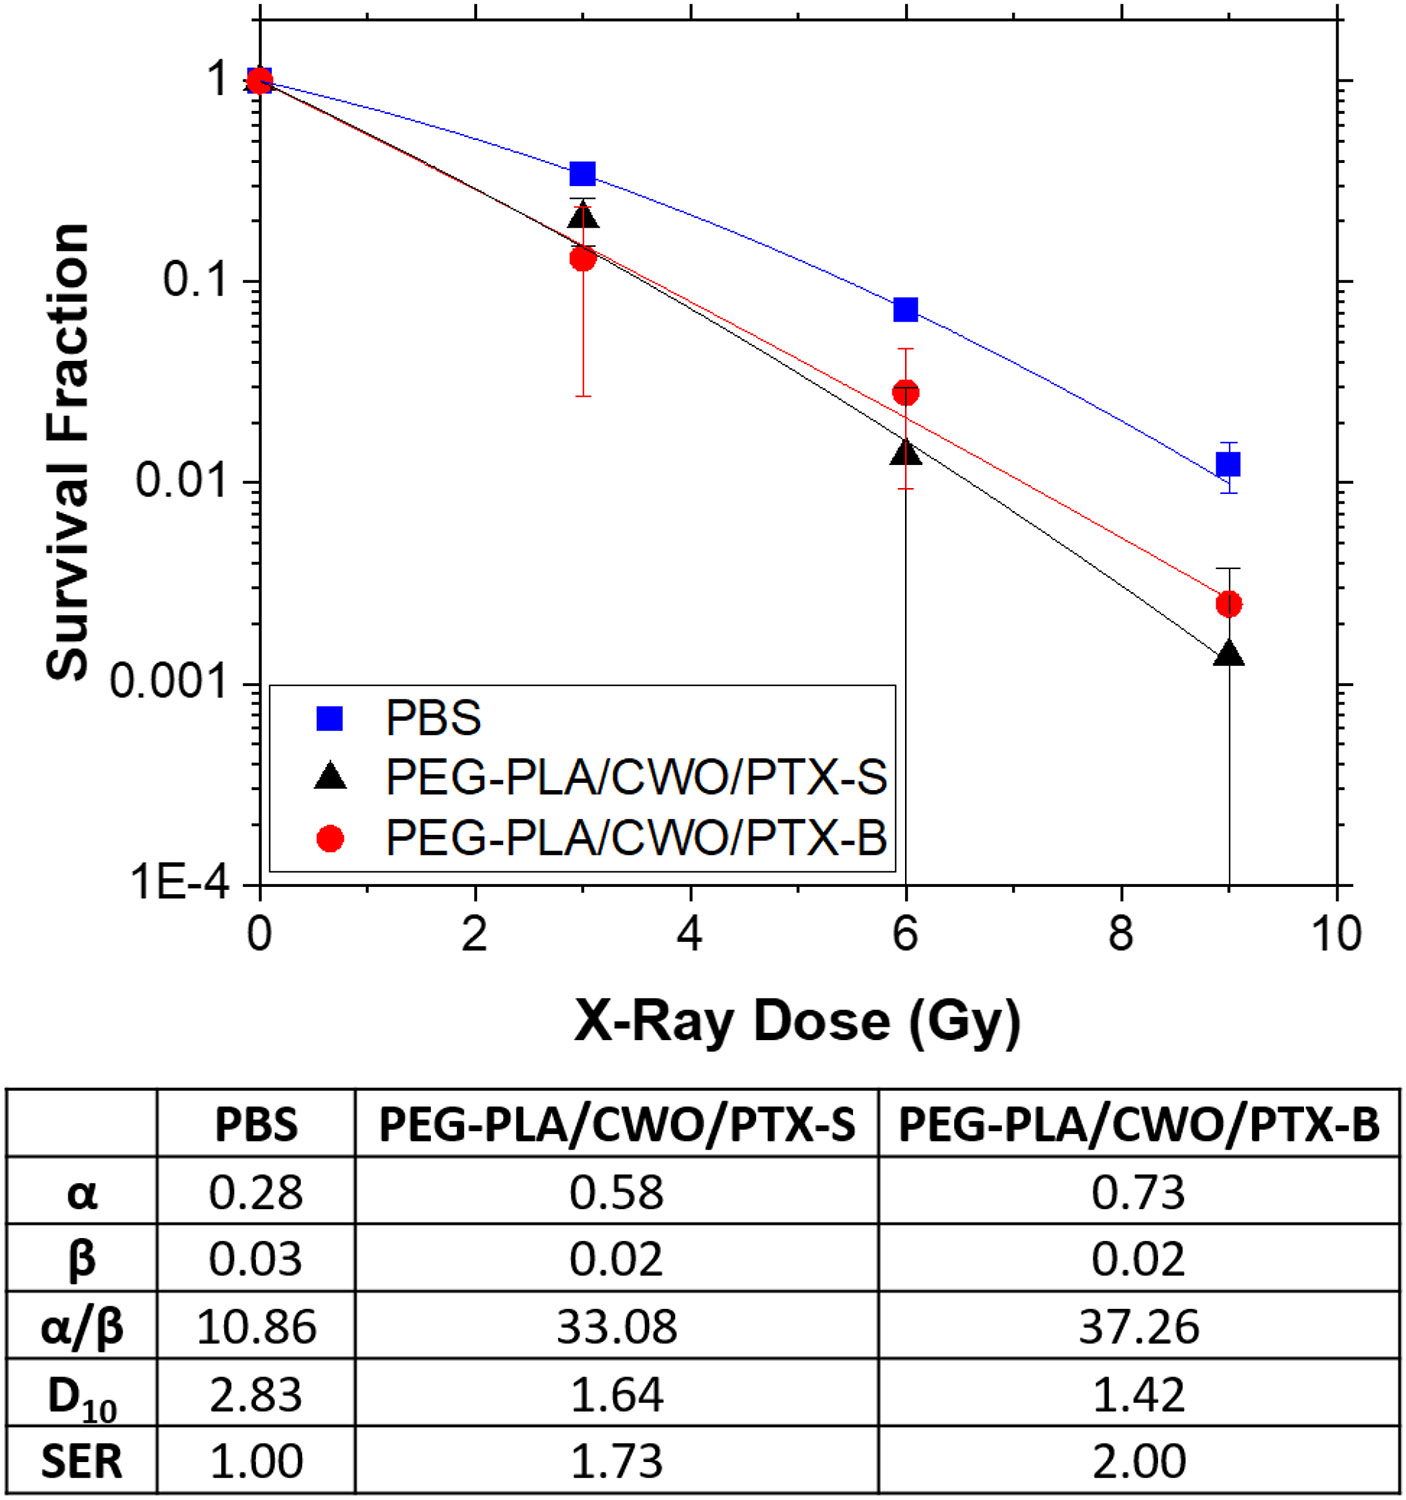
HN31 cells were plated in 60-mm plates at 1 × 10³ (0 Gy), 2 × 10³ (3 Gy), 4 × 10³ (6 Gy) and 8 × 10³ (9 Gy) cells per plate (N = 3 per group). Cells were treated with PBS (control), PEG-PLA/CWO/PTX-S NPs (0.2 mg/mL CWO concentration) and PEG-PLA/CWO/PTX-B NPs (0.2 mg/mL CWO concentration) for 4 hours prior to X-ray irradiation (320 kV, 2.13 Gy/min). Data were fit to the standard exponential-quadratic decay formula, , where is the survival fraction, D is the X-ray dose, and and are fitting parameters. Fitting results are summarized in the table underneath the figure; and SER represent the radiatio dose at 10% clonogenic survival and the sensitization enhancement ratio (), respectively. Error bars represent standard deviations. Note: Unfiltered nanoparticles were used for this study.
3.3. Effects of the stereochemical structure of PTX on the in vivo pharmacological properties of PEG-PLA/CWO/PTX NPs
The pharmacokinetic properties and therapeutic efficacy of intratumorally (IT) administered PEG-PLA/CWO/PTX-S and PEG-PLA/CWO/PTX-B NP formulations were evaluated in mouse HN31 xenografts (immunodeficient NRG mice) in vivo.
First, in order to confirm the complete retention of the NPs within the tumor post IT injection, biodistribution (BD) measurements were performed by tracking the concentrations of CaWO4 in major/excretory organs (tumor, brain, heart, kidneys, liver, lungs, and spleen) at various times (up to 1 month). Specifically, in each arm of study (PEG-PLA/CWO/PTX-S vs. PEG-PLA/CWO/PTX-B), total 21 animal subjects were divided into 7 groups (6 treatment groups plus a control group, N = 3 per group). Mice bearing subcutaneous xenografts of HN31 cells in the 6 treatment groups were given a 7 mg/cc (CWO mass/tumor volume) dose of PEG-PLA/CWO/PTX-S NPs (0.1 mL of 7 mg/mL (based on CWO mass) PEG-PLA/CWO/PTX-S NP suspension in PBS) or a 10 mg/cc (CWO mass/tumor volume) dose of PEG-PLA/CWO/PTX-B NPs (0.1 mL of 10 mg/mL (based on CWO mass) PEG-PLA/CWO/PTX-B NP suspension in PBS), in 2 portions over 2 days (Days 0 and 1) and then irradiated with a total 8 Gy dose of fractionated 320-keV X-ray irradiation delivered in 4 fractions (2 Gy per fraction per day) over 4 days (Days 1, 2, 3 and 4). These mice were sacrificed for NP BD analysis at 6 different time points (at 1 (post radiation), 3 (post radiation), 5, 7, 15 and 30 days for PEG-PLA/CWO/PTX-S NPs, and at 2 (post radiation), 4 (post radiation), 6, 8, 16 and 31 days for PEG-PLA/CWO/PTX-B NPs). Mice bearing the same tumor in the control group received the same volume (0.1 mL) of vehicle (PBS) devoid of NPs, but were not irradiated. Tumor, brain, heart, kidney, liver, lung and spleen tissues were collected post euthanasia, and the calcium contents in these organs were analyzed by atomic absorption spectroscopy (AAS). As shown in Figure S4, the results confirmed that in both PEG-PLA/CWO/PTX-S and PEG-PLA/CWO/PTX-B cases, the injected NPs stayed within the tumor for at least 1 month. This complete retention of PEG-PLA/CWO/PTX NPs within the tumor is key to maximizing the therapeutic benefit, while minimizing the risk of systemic toxicity of PTX, and as demonstrated below, such a trait also enabled us to quantitatively determine kinetic parameters associated with the radiation-controlled PTX release process.
The tumor tissues collected in the above experiments were also analyzed to determine the PK profiles of PTX-S and PTX-B within the tumor (N = 3). The tissue sample was homogenized by a ball bearing impact process at 5,500 rpm for 4 minutes, and the PTX was extracted from the resulting homogenate by liquid-liquid extraction with dichloromethane and quantified by HPLC. The results are presented in Figure 11. In order to quantitatively assess any differences in inherent kinetic properties between PTX-S and PTX-B, the measured PK profiles were compared with predictions of a multi-compartmental PK model. Briefly, this multi-compartmental model assumes the following set of PTX mass balance equations [50]
| (3) |
| (4) |
| (5) |
the definitions of the notations are given in Figure 12. Note in Ref. [50] the third term on the right-hand side of Eq. (4) was ignored, because for human solid tumors the growth in tumor volume () is typically negligible over the timescale relevant to PTX clearance/metabolism; in the present study, however, this term was kept in the model, because the tumor grows much more rapidly in size in the mouse xenograft situation. As shown in Figure 11, the experimentally determined overall intratumoral PTX concentration vs. time data were fit to the above model with one adjustable parameter, (the first-order rate constant for PTX elimination from the xenograft). The values of k (the rate constant for PTX release from the PLA layer) were assumed to be 0.0018 h−1 under unirradiated conditions and 0.0037 h−1 during the 4-day period post immediately following 2 Gy X-ray irradiation (both values estimated from the in vitro data presented in Figure 9 and in Ref. [50]). The first-order rate constant for PTX elimination from the total body () was fixed to a literature value of 0.0050 h−1 [68]; note played little role in the fitting process. As shown in Figure 11, the multi-compartmental model was able to fit the data quite well. The best-fit tumor elimination rate constant values were for PTX-S and 0.10 h−1 for PTX-B. Note these values are significantly greater than the value reported for PTX elimination from orthotopic tumors () [68]. The trend between the two PTX stereoisomers, PTX-S vs. PTX-B, is consistent with their difference in water solubility (Figure 7A); PTX-S is eliminated faster from the tumor because it has a higher water solubility than PTX-B. As shown in Figure 11, the difference in values produced a significant difference in intratumoral PK profiles; in the PEG-PLA/CWO/PTX-S case, the overall intratumoral PTX concentration sharply peaked between 1 and 3 days post initial NP injection and went down below 10 μg/mg at 3 days and onward, whereas in the PEG-PLA/CWO/PTX-B case, the initial peak in the overall PTX concentration had a longer tail on the tailing edge that lasted for more than ~ 15 days. Note that the data shown in Figures 11(A) and 11(B) were obtained using different initial PTX doses (due to an unintentional error); the total PTX doses used were 15.0 mg/cc of tumor for PTX-S and 21.4 mg/cc of tumor for PTX-B. However, as shown in Figure 11(C), simulations confirmed that the above differences between the PTX-S and PTX-B release behaviors would be exactly reproduced even if the two formulations would be tested under an identical PTX dose condition. The multi-compartmental PK model predicts that at an identical initial NP dose of 10.0 mg CWO/cc tumor (equivalent to 21.4 mg PTX/cc tumor), for instance, the PEG-PLA/CWO/PTX-S formulation will maintain the intratumoral concentration of PTX (Ct) above the therapeutic threshold (IC10 ≅ 10 μg/mL [69]) for > about 5 days, whereas the PEG-PLA/CWO/PTX-B formulation will show a lower maximum in Ct but will have for a much longer period of time (> 11 days); at an identical dose, PEG-PLA/CWO/PTX-B NPs will provide a slower rate of PTX release and as a result a longer period of therapeutic effect than PEG-PLA/CWO/PTX-S NPs. This difference in PK profiles indeed caused differences in tumor responses to the X-ray + PEG-PLA/CWO/PTX NP treatment, as will be discussed next. In both PEG-PLA/CWO/PTX-S and PEG-PLA/CWO/PTX-B cases, the PTX concentrations in the systemic circulation are predicted to remain below the toxic threshold at all times (Figure S5).
Figure 11. In vivo intratumoral PTX pharmacokinetic (PK) profiles following intratumoral administration of PEG-PLA/CWO/PTX NPs into HNSCC xenografts in mice.
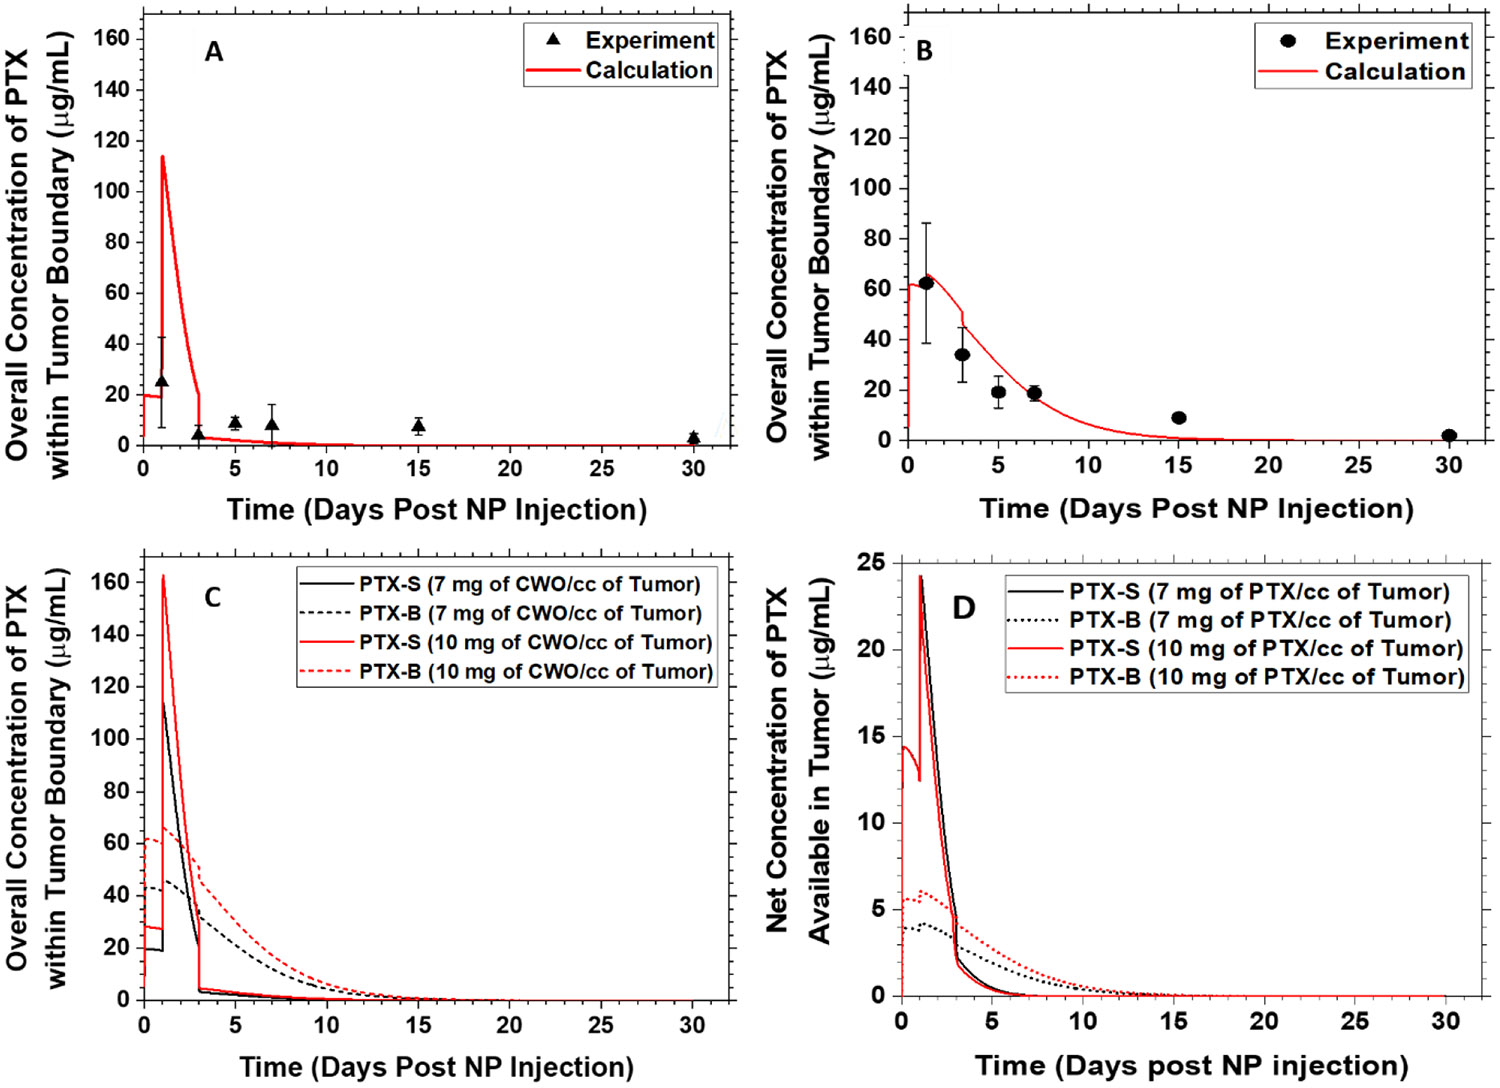
Subcutaneous HN31 xenografts were produced in Nod rag gamma (NRG) mice by inoculating 1 × 10⁶ HN31 cells into the upper right flank of each mouse (Days −5)). 100 μL of a (A) 7 mg/mL (based on CWO mass) PEG-PLA/CWO/PTX-S or (B) 10 mg/mL (based on CWO mass) PEG-PLA/CWO/PTX-B NP suspension in sterile PBS was injected twice over 2 days (Days 0 and 1) once the tumors reached a volume of 100 mm3. The control group was treated with blank PBS. The mice were subjected to a sub-therapeutic dose of 320-keV X-ray radiation (total 8 Gy given in daily fractions of 2 Gy per fraction over 4 days (Days 1, 2, 3 and 4). Tumor dimensions were measured using a digital caliper. Mice were euthanized at 1, 3, 5, 7, 15 and 30 days post NP injection (N = 6 for each time group). Whole tumor tissues were collected after euthanasia, homogenized via agitation with ceramic beads, and extracted with 2 mL of DCM. The extract was dried, re-dissolved in 2 mL of ACN, and analyzed by HPLC for the concentration of PTX in the tumor tissue; this measured overall concentration of PTX within the tumor boundary represents the sum of the amounts of PTX remaining in the polymer matrix plus PTX remaining in the tumor, and is thus equal to , referring to the notations defined in Figure 12. Error bars represent standard deviations. Note: Unfiltered nanoparticles were used for this study. The PEG-PLA:CWO:PTX loading ratios were determined by TGA, AAS and HPLC to be 1.77:1.00:0.56 for PEG-PLA/CWO/PTX-S NPs and 2.44:1.00:0.55 for PEG-PLA/CWO/PTX-B NPs. Solid curves are predictions of the multi-compartmental PK model described in Figure 12. (C) Comparison of predicted PK profiles for PEG-PLA/CWO/PTX-B and PEG-PLA/CWO/PTX-S NPs at two different dose conditions. (D) Predicted net concentrations of PTX available in the tumor () as a function of time at two different dose conditions. Note: Unfiltered nanoparticles were used for this study.
Figure 12. Schematic depiction of the multi-compartmental pharmacokinetic (PK) model.
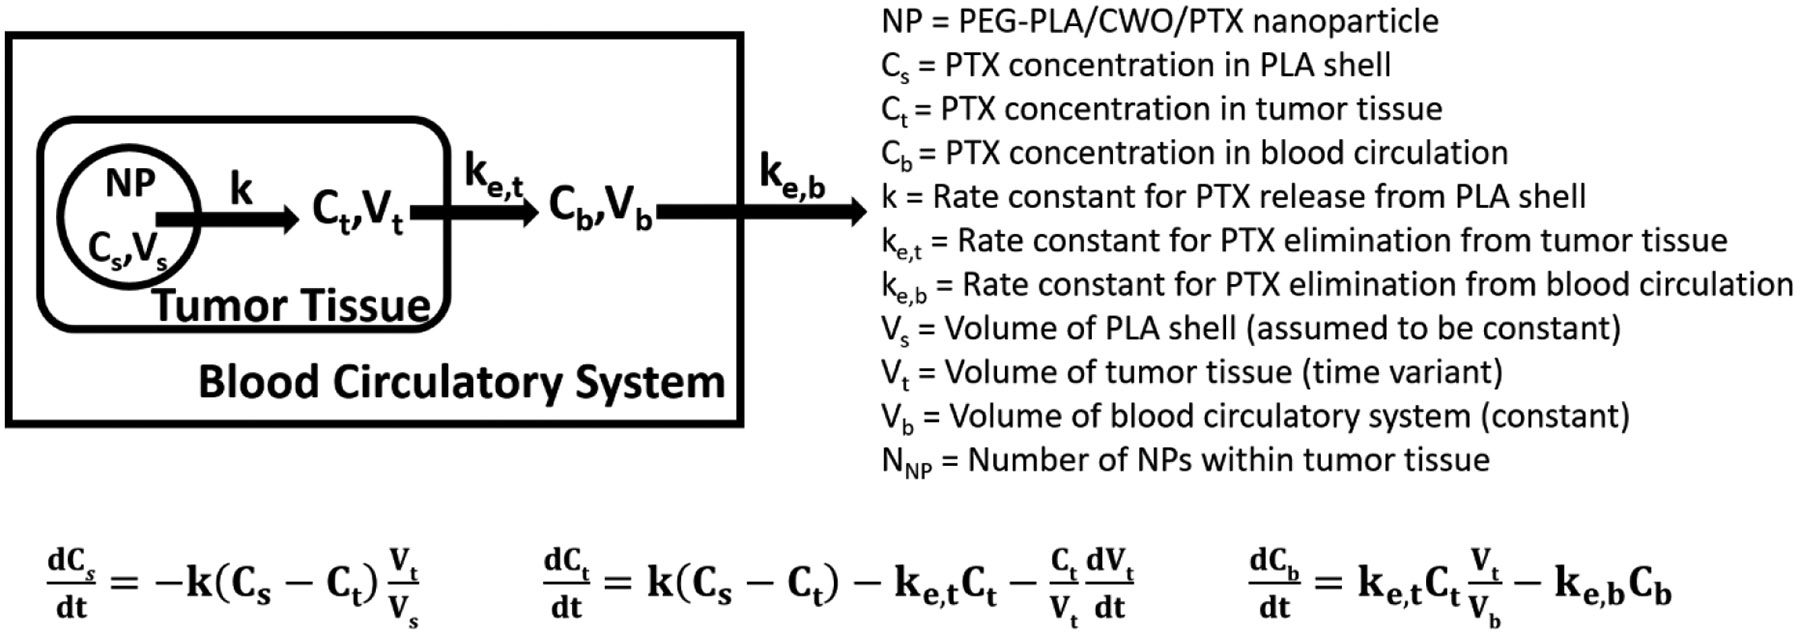
A multi-compartmental PK model was used to compute the data shown in Figure 11. See main text for discussion.
The therapeutic efficacies of the PEG-PLA/CWO/PTX-S and PEG-PLA/CWO/PTX-B formulations were evaluated in immune-deficient (NRG) mice bearing human head and neck cancer (HN31) xenografts. Tumors were treated with PBS (vehicle) ± X-rays, or PEG-PLA/CWO/PTX-S (or PEG-PLA/CWO/PTX-B) NPs ± X-rays (N = 8 per treatment group), and their responses were analyzed. Briefly, HN31 xenografts were prepared by inoculating 1 × 10⁶ cells into the right flank of each mouse. Once tumors grew to 100 mm3, PEG-PLA/CWO/PTX NPs were injected into the tumor (to a total CWO NP concentration of 7 mg per cc of tumor) in two portions (50 μL PBS suspension per injection) over 2 days. On the next 4 days, tumors were irradiated with 320-keV X-rays at a total dose of 8 Gy given in 4 fractions. At regular time intervals, tumor dimensions were measured using a caliper. Mice were euthanized when the tumor exceeded 2,000 mm3 in size or the body weight loss exceeded 20% of the initial body weight. The results of these experiments are presented in Figures 13 (tumor growth curves) and 14 (Kaplan-Meier survival curves).
Figure 13. Effects of intratumoral chemoradiation on tumor growth in mice.
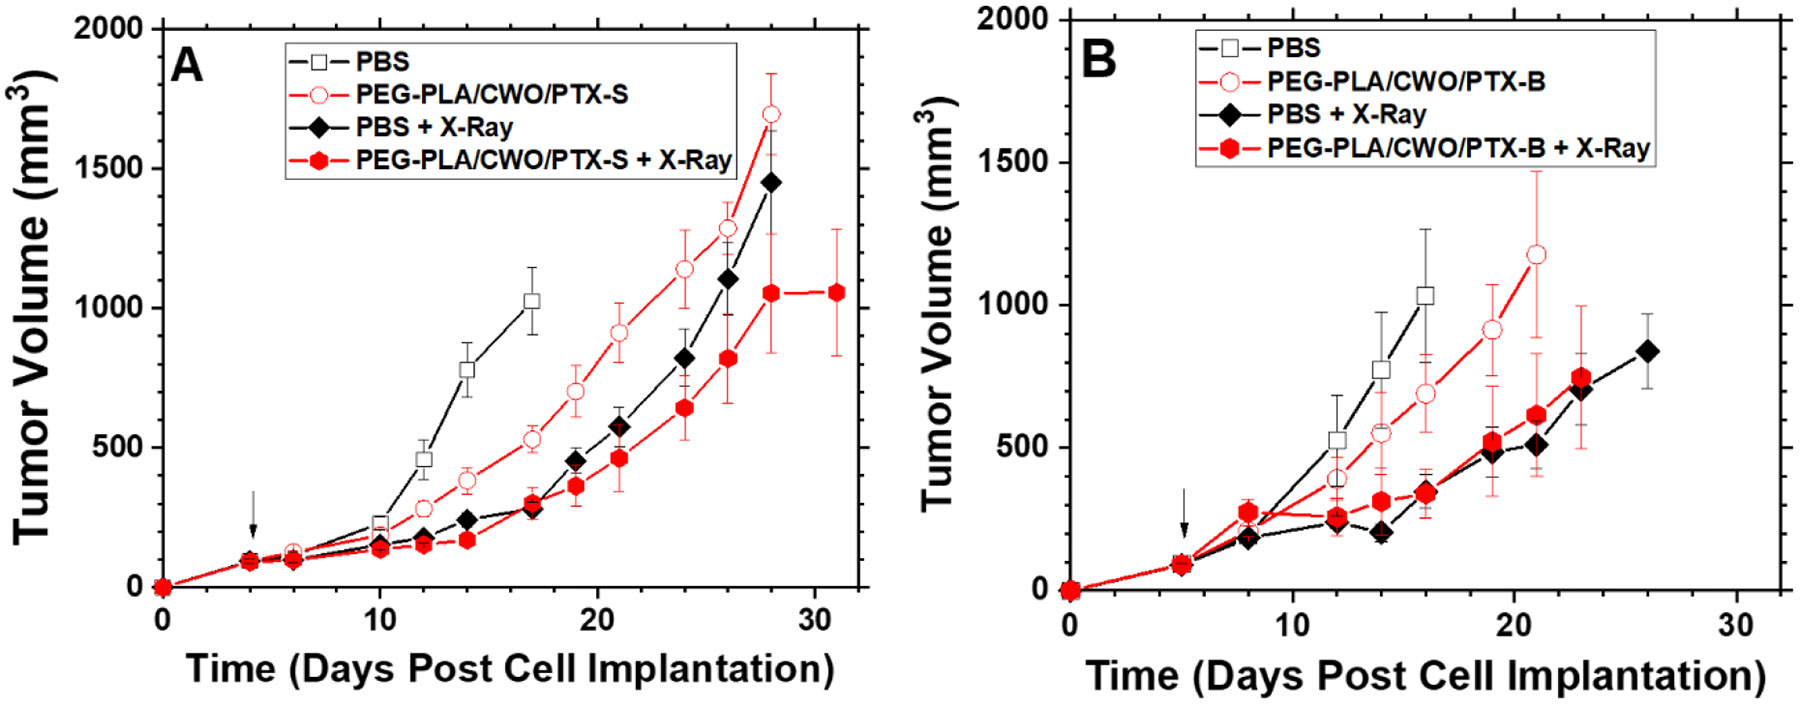
Tumor suppression efficacies of (A) PEG-PLA/CWO/PTX-S NPs ± X-rays and (B) PEG-PLA/CWO/PTX-B NPs ± X-rays. Subcutaneous HN31 xenografts were produced in Nod rag gamma (NRG) mice by injecting 1 x 10⁶ HN31 cells in 1 mL of sterile PBS into the upper right flank of the mice on Day 0. When tumors averaged 100 mm3, 100 μL of 15 mg/mL (based on PTX mass) PEG-PLA/CWO/PTX NPs in sterile PBS or blank sterile PBS (control) was directly injected into the tumor (N = 8 each group) over 2 days (A) on Days 3 and 4 or (B) on Days 4 and 5 (50 μL injected each day). Some mice were further treated with a sub-therapeutic dose of 320-keV X-ray radiation (total 8 Gy given in daily fractions of 2 Gy per fraction over 4 days ((A) on Days 4, 5, 6 and 7 or (B) on Days 5, 6, 7 and 8); the first day of radiation treatment is marked with an arrow. Tumor dimensions were measured using a digital caliper. Mice were euthanized when the tumors reached 2000 mm3 or mice lost more than 20% weight. For each group, tumor volume data are shown up to the day of the second euthanasia case. Error bars represent standard errors. Note: Unfiltered nanoparticles were used for this study. Statistical analysis was performed using one-way ANOVA on pairs of groups. The resulting p-values are summarized in Tables S1 and S2 of the SI.
Firstly, we note that, as shown in Figure 13, PEG-PLA/CWO/PTX NPs suppressed tumor growth in HN31 xenografts even in the absence of X-rays, which indicates that some (small) amounts of PTX were still released even in the absence of X-rays, as has been observed in our earlier study [50]. The tumor suppressive effect was greater with PTX-S (Figure 13(A)) than PTX-B (Figure 13(B)), which is consistent with the higher water solubility of PTX-S. X-rays alone produced greater tumor suppression than unirradiated PEG-PLA/CWO/PTX NPs (Figures 13(A) and 13(B)). As shown in Figure 13(A), concurrent PEG-PLA/CWO/PTX-S NPs further enhanced the tumor growth delay produced by X-rays; of note, the radio-enhancement effect observed in the present study is smaller than what was observed in the previous study [50] because of the different NPs doses used (7 vs. 10 mg (based on CWO mass) per cc of tumor in the present and previous experiments, respectively). Interestingly, the radio-enhancement effect of PEG-PLA/CWO/PTX-B NPs was not clearly visible when the increase in tumor size was traced only up to the date of the occurrence of the second euthanasia case in the treatment group (Figure 13(B)); in the PTX-B case, its effect was not detectable early on, because of its slower release kinetics.
Similar trends were also replicated in the survival distributions for the different treatment groups (Figure 14); that is, “PBS” (22 days) < “PEG-PLA/CWO/PTX-B” (25 days) < “PEG-PLA/CWO/PTX-B + X-Ray” (28 days) < “PEG-PLA/CWO/PTX-S” (31 days) < “PBS + X-Ray” (34 days) < “PEG-PLA/CWO/PTX-S + X-Ray” (38 days) in median mouse survival time. Interestingly, as shown in Figure 14, in animals who survived for longer periods (> ~ 1 month post cell implantation), the therapeutic benefit of the slower releasing PTX-B was more clearly observed; the PEG-PLA/CWO/PTX-B + X-ray-treated group (Figure 14(B)) exhibited a markedly longer tail in the survival distribution than the PEG-PLA/CWO/PTX-S + X-ray-treated group (Figure 14(A)). We would like to note that the difference in overall survival between the “PEG-PLA/CWO/PTX-S + X-Ray” and “PEG-PLA/CWO/PTX-B + X-Ray” groups was reflected in their p-values relative to their respective “PBS + X-Ray” controls (i.e., p = 0.096 for “PEG-PLA/CWO/PTX-S” (Table 1), and p = 0.406 for “PEG-PLA/CWO/PTX-B” (Table 2)). These results suggest that faster release of PTX results in greater tumor suppression. These results clearly reflect the slower and more sustained release of PTX-B from the PEG-PLA/CWO NPs (Figures 9 and 11) because of its lower water solubility than PTX-S (Figure 7).
Figure 14. Effects of intratumoral chemoradiation on survival of tumor-bearing mice.
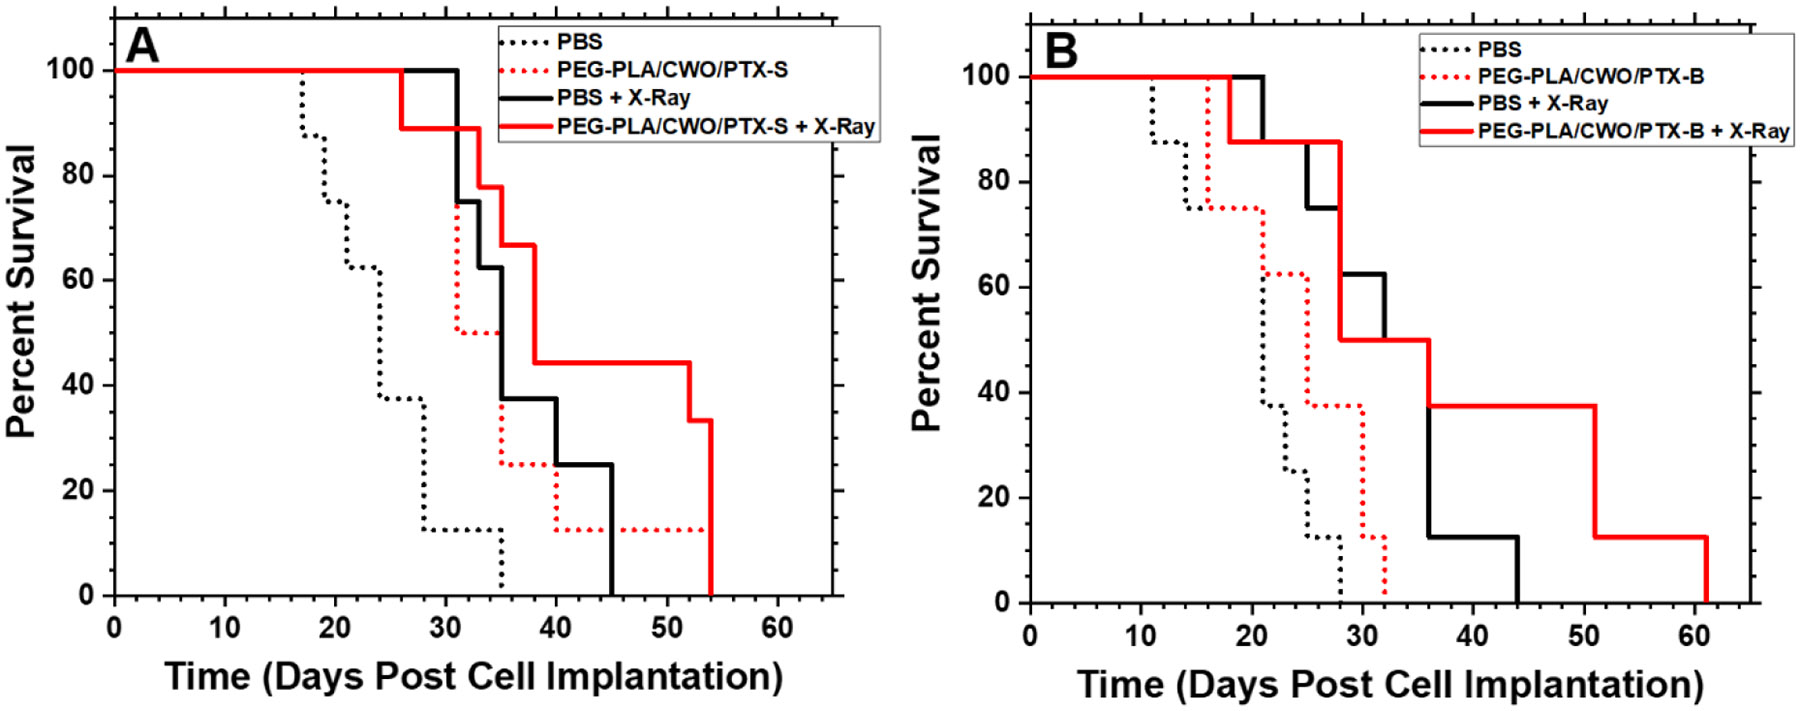
Kaplan-Meier survival curves for HN31 xenograft-bearing mice treated with (A) PEG-PLA/CWO/PTX-S NPs + X-rays and (B) PEG-PLA/CWO/PTX-B NPs + X-rays in comparison with commercial PTX formulations (Genexol-PM and Taxol). Data were obtained from the same study as shown in Figure 13. Statistical analysis was performed using the log-rank test. The resulting p-values are summarized in Tables 1 and 2.
4. Conclusions
This work demonstrates the effect of drug (PTX) stereochemistry on radiation-controlled release of the drug from a nano polymer matrix system (PEG-PLA micelle capsules co-loaded with CWO NPs). The stereoisomertic characteristics of PTX products from two different manufacturers (“PTX-S” from Samyang Biopharmaceuticals, and “PTX-B” from Biotang) were analyzed by Raman spectroscopy, circular dichroism and 2D HMQC/NOESY NMR measurements (Figures 4 and 6). In their unencapsulated (free) state, PTX-S and PTX-B were comparable in their ability to kill cancer cells in vitro (Figure 8). However, they were found to be significantly different in water solubility; PTX-S (water solubility ≈ 4.69 μg/mL) is about 19 times more water soluble than PTX-B (water solubility ≈ 0.25 μg/mL) (Figure 7). This difference in water solubility was found to cause a large difference in X-ray-triggered release kinetics of the PTX loaded within the PEG-PLA-coated CWO NPs (“PEG-PLA/CWO/PTX NPs”) in both in vitro (Figure 9) and in vivo (Figure 11) environments; PTX-S is released from PEG-PLA/CWO NPs significantly faster upon X-ray irradiation than PTX-B. This difference in release kinetics produced an interesting difference in their time-dependent therapeutic effects; at short times (< 1 month), concurrent PEG-PLA/CWO/PTX-S NPs produced a greater tumor suppression effect (Figure 13); on the other hand, PEG-PLA/CWO/PTX-B NPs had a longer lasting radio-sensitizing effect, as evidenced by the elongated tail of the mouse survival curve (Figure 14). These results demonstrate the importance of a drug’s stereochemistry/hydrophobicity in controlling its release from a radiation-responsive carrier system. It is a remarkable finding that the stereoisomers of PTX exhibit significantly different PK characteristics when used with controlled release carriers, even though they are pharmacologically indistinguishable in their unformulated form.
Supplementary Material
Acknowledgements
Funding for this research was provided by Purdue Office of the Executive Vice President for Research and Partnerships (OEVPRP) (New NIH R01 Program), Purdue University Center for Cancer Research (PCCR, P30CA023168) (Shared Resource Biological Evaluation Project, Phase I Concept Award, and Challenge Research Award), Purdue University Discovery Park (Walther Oncology Physical Sciences & Engineering Research Embedding Program), Lodos Theranostics LLC (Gift Grant), and the Davidson School of Chemical Engineering at Purdue University. The HN31 cell line was generously provided by Dr. Jeffrey N. Myers at the MD Anderson Cancer Center. YYW is also grateful for funding from NSF (CBET-1803968). KS is also grateful for the Leslie Bottorff Fellowship (formerly known as the Innovation for Clinical Translation Fellowship) from Purdue University. Prof. John A. Morgan in the Davidson School of Chemical Engineering at Purdue University is gratefully acknowledged for helpful suggestions regarding the 2D NMR measurements described in this paper. Melanie P. Currie is thanked for assistance with animal studies. KS is grateful for the Purdue University College of Engineering/Indiana University School of Medicine Innovation for Clinical Translation (ICT) Fellowship (name changed to Bottorff Fellowship). We would also like to thank Prof. Jianguo Mei in the Purdue Department of Chemistry for allowing us to use his GPC instrument and Mr. Mustafa Ahmed for assistance with GPC measurements.
Footnotes
Supporting Information (SI)
The Supporting Information is available free of charge on the ACS Publications website: 1H NMR of PEG-PLA (Figure S1); DLS (Figure S2) and TGA (Figure S3) of PEG-PLA/CWO/PTX NPs; biodistribution of IT-administered PEG-PLA/CWO/PTX NPs in mice (Figure S4); predicted concentration of PTX in blood after treatment with PEG-PLA/CWO/PTX NPs (Figure S5); H&E images of tumor/organ tissues (Figure S6); p-values for tumor growth curves shown in Figures 13(A) and 13(B) (Tables S1 and S2, respectively).
References
- [1].Martin V, Overview of paclitaxel (TAXOL), Semin Oncol Nurs, 9 (1993) 2–5. [DOI] [PubMed] [Google Scholar]
- [2].H.a.B. MAa.B. Sa.P. FHa.A. FJ, Nanopaclitaxel therapy: an evidence based review on the battle for next-generation formulation challenges, Nanomedicine, 14 (2019) 1323–1341. [DOI] [PubMed] [Google Scholar]
- [3].M. Amanda Starling-Windhof and Asur Srinivasan and Tina Tomeo and Anne Marie Clark and Peter, Chapter 10 - Trends in the intellectual property (IP) landscape of drug delivery systems: 30 years of growth and evolution, (2020) 201–230. [Google Scholar]
- [4].Song JI, Dumais MR, From yew to us: the curious development of taxol, Jama, 266 (1991) 1281. [DOI] [PubMed] [Google Scholar]
- [5].Weaver BA, How Taxol/paclitaxel kills cancer cells, Molecular Biology of the Cell, 25 (2014) 2677–2681. [DOI] [PMC free article] [PubMed] [Google Scholar]
- [6].Wani MC, Taylor HL, Wall ME, Coggon P, McPhail AT, Plant antitumor agents. VI. Isolation and structure of taxol, a novel antileukemic and antitumor agent from Taxus brevifolia, Journal of the American Chemical Society, 93 (1971) 2325–2327. [DOI] [PubMed] [Google Scholar]
- [7].Blume E, Investigators Seek To Increase Taxol Supply, JNCI: Journal of the National Cancer Institute, 81 (1989) 1122–1123. [DOI] [PubMed] [Google Scholar]
- [8].Exposito O, Bonfill M, Moyano E, Onrubia M, Mirjalili MH, Palazon R.M.C.a.J., Biotechnological Production of Taxol and Related Taxoids: Current State and Prospects, Anti-Cancer Agents in Medicinal Chemistry, 9 (2009) 109–121. [DOI] [PubMed] [Google Scholar]
- [9].Bringi V, Kadkade P, Prince C, Roach B, Enhanced production of paclitaxel and taxanes by cell cultures of Taxus species, in, Google Patents, 2012. [Google Scholar]
- [10].Schiff PB, Fant J, Horwitz SB, Promotion of microtubule assembly in vitro by taxol, Nature, 277 (1979) 665–667. [DOI] [PubMed] [Google Scholar]
- [11].Rowinsky EK, Cazenave LA, Donehower RC, Taxol: A Novel Investigational Antimicrotubule Agent, JNCI: Journal of the National Cancer Institute, 82 (1990) 1247–1259. [DOI] [PubMed] [Google Scholar]
- [12].Wang TH, Wang HS, Soong YK, Paclitaxel-induced cell death: where the cell cycle and apoptosis come together, Cancer, 88 (2000) 2619–2628. [DOI] [PubMed] [Google Scholar]
- [13].Zanelli GD, Quaia M, Robieux I, Bujor L, Santarosa M, Favaro D, Spada A, Caffau C, Gobitti C, Trovò MG, Paclitaxel as a radiosensitiser: A proposed schedule of administration based on in vitro data and pharmacokinetic calculations, European Journal of Cancer, 33 (1997) 486–492. [DOI] [PubMed] [Google Scholar]
- [14].Hiro J, Inoue Y, Toiyama Y, Yoshiyama S, Tanaka K, Mohri Y, Miki C, Kusunoki M, Possibility of paclitaxel as an alternative radiosensitizer to 5-fluorouracil for colon cancer, Oncology Reports, 24 (2010) 1029–1034. [DOI] [PubMed] [Google Scholar]
- [15].Liebmann J, Cook JA, Fisher J, Teague D, Mitchell JB, In Vitro Studies of Taxol as a Radiation Sensitizer in Human Tumor Cells, JNCI: Journal of the National Cancer Institute, 86 (1994) 441–446. [DOI] [PubMed] [Google Scholar]
- [16].Gabikian P, Tyler BM, Zhang I, Li KW, Brem H, Walter KA, Radiosensitization of malignant gliomas following intracranial delivery of paclitaxel biodegradable polymer microspheres, Journal of Neurosurgery JNS, 120 (2014) 1078. [DOI] [PMC free article] [PubMed] [Google Scholar]
- [17].Abouelmagd SA, Sun B, Chang AC, Ku YJ, Yeo Y, Release kinetics study of poorly water-soluble drugs from nanoparticles: are we doing it right?, Mol Pharm, 12 (2015) 997–1003. [DOI] [PMC free article] [PubMed] [Google Scholar]
- [18].Gelderblom H, Verweij J, Nooter K, Sparreboom A, Cremophor EL: the drawbacks and advantages of vehicle selection for drug formulation, European Journal of Cancer, 37 (2001) 1590–1598. [DOI] [PubMed] [Google Scholar]
- [19].van Zuylen L, Verweij J, Sparreboom A, Role of Formulation Vehicles in Taxane Pharmacology, Investigational New Drugs, 19 (2001) 125–141. [DOI] [PubMed] [Google Scholar]
- [20].Kanotra S, Kanotra S, Gupta A, Paul J, Chemoradiation in Advanced Head and Neck Cancers: A Comparison of two Radiosensitizers, Paclitaxel and Cisplatin, Indian Journal of Otolaryngology and Head & Neck Surgery, 63 (2011) 229–236. [DOI] [PMC free article] [PubMed] [Google Scholar]
- [21].Citrin D, Mansueti J, Likhacheva A, Sciuto L, Albert P, Rudy S, Cooley-Zgela T, Cotrim A, Solomon B, Colevas A, Russo A, Morris J, Herscher L, Smith S, Van Waes C, Long-term outcomes and toxicity of concurrent paclitaxel and radiotherapy for locally advanced head-and-neck cancer, International Journal of Radiation Oncology Biology Physics, 74 (2009) 1040–1046. [DOI] [PMC free article] [PubMed] [Google Scholar]
- [22].Givens D, Karnell L, Gupta A, Clamon G, Pagedar N, Chang K, Van Daele D, Funk G, Adverse Events Associated With Concurrent Chemoradiation Therapy in Patients With Head and Neck Cancer, Archives of Otolaryngology-Head & Neck Surgery, 135 (2009) 1209–1217. [DOI] [PubMed] [Google Scholar]
- [23].Falchook A, Green R, Knowles M, Amdur R, Mendenhall W, Hayes D, Grilley-Olson J, Weiss J, Reeve B, Mitchell S, Basch E, Chera B, Comparison of Patient-and Practitioner-Reported Toxic Effects Associated With Chemoradiotherapy for Head and Neck Cancer, JAMA Otolaryngology-Head & Neck Surgery, 142 (2016) 517–523. [DOI] [PMC free article] [PubMed] [Google Scholar]
- [24].Gupta A, Baxi S, Hoyne C, Assessing feasibility, compliance and toxicity of concomitant chemo-radiotherapy in head and neck cancers in the Northern Territory: initial experience and challenges, J Med Radiat Sci, 64 (2017) 131–137. [DOI] [PMC free article] [PubMed] [Google Scholar]
- [25].G. MRa.M. GMa.O. Sa.A. Ba.M. AMa.B. Pa.Hawkins MJ, Abraxane®, a novel Cremophor®-free, albumin-bound particle form of paclitaxel for the treatment of advanced non-small-cell lung cancer, Annals of Oncology, 17 (2006) 1263–1268. [DOI] [PubMed] [Google Scholar]
- [26].Seidman AD, Conlin AK, Bach A, Moynahan ME, Lake D, Forero A, Wright GS, Hackney MH, Clawson A, Norton L, Hudis CA, Randomized Phase II Trial of Weekly vs. Every 2 Weeks vs. Every 3 Weeks Nanoparticle Albumin-Bound Paclitaxel With Bevacizumab as First-Line Chemotherapy for Metastatic Breast Cancer, Clinical Breast Cancer, 13 (2013) 239–246.e231. [DOI] [PubMed] [Google Scholar]
- [27].Lee KS, Chung HC, Im SA, Park YH, Kim CS, Kim S-B, Rha SY, Lee MY, Ro J, Multicenter phase II trial of Genexol-PM, a Cremophor-free, polymeric micelle formulation of paclitaxel, in patients with metastatic breast cancer, Breast Cancer Research and Treatment, 108 (2008) 241–250. [DOI] [PubMed] [Google Scholar]
- [28].Wang J, Li S, Han Y, Guan J, Chung S, Wang C, Li D, Poly(Ethylene Glycol)-Polylactide Micelles for Cancer Therapy, Frontiers in pharmacology, 9 (2018) 202–202. [DOI] [PMC free article] [PubMed] [Google Scholar]
- [29].Xiao RZ, Zeng ZW, Zhou GL, Wang JJ, Li FZ, Wang AM, Recent advances in PEG-PLA block copolymer nanoparticles, International journal of nanomedicine, 5 (2010) 1057–1065. [DOI] [PMC free article] [PubMed] [Google Scholar]
- [30].Wang J, Li W, Zhu J, Encapsulation of inorganic nanoparticles into block copolymer micellar aggregates: Strategies and precise localization of nanoparticles, Polymer, 55 (2014) 1079–1096. [Google Scholar]
- [31].Weinberg BD, Blanco E, Gao J, Polymer Implants for Intratumoral Drug Delivery and Cancer Therapy, Journal of Pharmaceutical Sciences, 97 (2008) 1681–1702. [DOI] [PubMed] [Google Scholar]
- [32].Goldberg EP, Hadba AR, Almond BA, Marotta JS, Intratumoral cancer chemotherapy and immunotherapy: opportunities for nonsystemic preoperative drug delivery, Journal of Pharmacy and Pharmacology, 54 (2010) 159–180. [DOI] [PubMed] [Google Scholar]
- [33].Danhier F, Feron O, Preat V, To exploit the tumor microenvironment: Passive and active tumor targeting of nanocarriers for anti-cancer drug delivery, Journal of Controlled Release, 148 (2010) 135–146. [DOI] [PubMed] [Google Scholar]
- [34].Sun Q, Radosz M, Shen Y, Challenges in design of translational nanocarriers, Journal of Controlled Release, 164 (2012) 156–169. [DOI] [PubMed] [Google Scholar]
- [35].Cao Z, Li W, Liu R, Li X, Li H, Liu L, Chen Y, Lv C, Liu Y, pH- and enzyme-triggered drug release as an important process in the design of anti-tumor drug delivery systems, Biomedicine & Pharmacotherapy, 118 (2019) 109340. [DOI] [PubMed] [Google Scholar]
- [36].Wibowo FR, Saputra OA, Lestari WW, Koketsu M, Mukti RR, Martien R, pH-Triggered Drug Release Controlled by Poly(Styrene Sulfonate) Growth Hollow Mesoporous Silica Nanoparticles, ACS Omega, 5 (2020) 4261–4269. [DOI] [PMC free article] [PubMed] [Google Scholar]
- [37].Kulkarni P, Haldar MK, You S, Choi Y, Mallik S, Hypoxia-Responsive Polymersomes for Drug Delivery to Hypoxic Pancreatic Cancer Cells, Biomacromolecules, 17 (2016) 2507–2513. [DOI] [PMC free article] [PubMed] [Google Scholar]
- [38].Kim J, Lee J, Kim K, Na K, Song S, Lee J, Kuh H, Intratumoral delivery of paclitaxel using a thermosensitive hydrogel in human tumor xenografts, Archives of Pharmacal Research, 36 (2013) 94–101. [DOI] [PubMed] [Google Scholar]
- [39].Wang W, Deng L, Xu S, Zhao X, Lv N, Zhang G, Gu N, Hu R, Zhang J, Liu J, Dong A, A reconstituted “two into one” thermosensitive hydrogel system assembled by drug-loaded amphiphilic copolymer nanoparticles for the local delivery of paclitaxel, Journal of Materials Chemistry B, 1 (2012) 552–563. [DOI] [PubMed] [Google Scholar]
- [40].Qiu M, Wang D, Liang W, Liu L, Zhang Y, Chen X, Sang DK, Xing C, Li Z, Dong B, Xing F, Fan D, Bao S, Zhang H, Cao Y, Novel concept of the smart NIR-light–controlled drug release of black phosphorus nanostructure for cancer therapy, Proceedings of the National Academy of Sciences, 115 (2018) 501. [DOI] [PMC free article] [PubMed] [Google Scholar]
- [41].Xu X, Lu H, Lee R, Near Infrared Light Triggered Photo/Immuno-Therapy Toward Cancers, Frontiers in Bioengineering and Biotechnology, 8 (2020). [DOI] [PMC free article] [PubMed] [Google Scholar]
- [42].Douplik A, Saiko G, Schelkanova I, Tuchin VV, 3 - The response of tissue to laser light, in: Jelínková H (Ed.) Lasers for Medical Applications, Woodhead Publishing, 2013, pp. 47–109. [Google Scholar]
- [43].Deng W, Chen W, Clement S, Guller A, Zhao Z, Engel A, Goldys EM, Controlled gene and drug release from a liposomal delivery platform triggered by X-ray radiation, Nature Communications, 9 (2018) 2713. [DOI] [PMC free article] [PubMed] [Google Scholar]
- [44].Zhang L, Zhang S, Xu J, Li Y, He J, Yang Y, Huynh T, Ni P, Duan G, Yang Z, Zhou R, Low-Dose X-ray-Responsive Diselenide Nanocarriers for Effective Delivery of Anticancer Agents, ACS Applied Materials & Interfaces, 12 (2020) 43398–43407. [DOI] [PubMed] [Google Scholar]
- [45].Wu S-Y, Chou H-Y, Yuh C-H, Mekuria SL, Kao Y-C, Tsai H-C, Radiation-Sensitive Dendrimer-Based Drug Delivery System, Advanced Science, 5 (2018) 1700339. [DOI] [PMC free article] [PubMed] [Google Scholar]
- [46].Liu H, Laan AC, Plomp J, Parnell SR, Men Y, Dalgliesh RM, Eelkema R, Denkova AG, Ionizing Radiation-Induced Release from Poly(ε-caprolactone-b-ethylene glycol) Micelles, ACS Applied Polymer Materials, 3 (2021) 968–975. [Google Scholar]
- [47].Brown LC, Mutter RW, Halyard MY, Benefits, risks, and safety of external beam radiation therapy for breast cancer, International journal of women's health, 7 (2015) 449–458. [DOI] [PMC free article] [PubMed] [Google Scholar]
- [48].Graupner A, Eide DM, Brede DA, Ellender M, Lindbo Hansen E, Oughton DH, Bouffler SD, Brunborg G, Olsen AK, Genotoxic effects of high dose rate X-ray and low dose rate gamma radiation in ApcMin/+ mice, Environmental and Molecular Mutagenesis, 58 (2017) 560–569. [DOI] [PMC free article] [PubMed] [Google Scholar]
- [49].Dracham CB, Shankar A, Madan R, Radiation induced secondary malignancies: a review article, Radiat Oncol J, 36 (2018) 85–94. [DOI] [PMC free article] [PubMed] [Google Scholar]
- [50].Rahul Misra KS, Lee Jaewon, Pizzuti Vincenzo J., Lee Deborah S., Currie Melanie P., Torregrosa-Allen Sandra E., Long David E., Durm Gregory A., Langer Mark P., Elzey Bennett D., Won You-yeon, Radioluminescent nanoparticles for radiation-controlled release of drugs, Journal of Controlled Release, 303 (2019) 237 – 252. [DOI] [PubMed] [Google Scholar]
- [51].Lee J, Rancilio N, Poulson J, Won Y, Block Copolymer-Encapsulated CaWO4 Nanoparticles: Synthesis, Formulation, and Characterization, Acs Applied Materials & Interfaces, 8 (2016) 8608–8619. [DOI] [PMC free article] [PubMed] [Google Scholar]
- [52].Lee J, Choi S, Kim K, Heng H, Torregrosa-Allen S, Ramsey B, Elzey B, Won Y, Nontoxic Formulations of Scintillation Nanocrystals for Use as X-ray Computed Tomography Contrast Agents, Bioconjugate Chemistry, 28 (2017) 171–182. [DOI] [PubMed] [Google Scholar]
- [53].Jo SD, Lee J, Joo MK, Pizzuti VJ, Sherck NJ, Choi S, Lee BS, Yeom SH, Kim SY, Kim SH, Kwon IC, Won Y-Y, PEG–PLA-Coated and Uncoated Radio-Luminescent CaWO4 Micro- and Nanoparticles for Concomitant Radiation and UV-A/Radio-Enhancement Cancer Treatments, ACS Biomaterials Science & Engineering, 4 (2018) 1445–1462. [DOI] [PubMed] [Google Scholar]
- [54].Pizzuti VJ, Viswanath D, Torregrosa-Allen SE, Currie MP, Elzey BD, Won Y-Y, Bilirubin-Coated Radioluminescent Particles for Radiation-Induced Photodynamic Therapy, ACS Applied Bio Materials, 3 (2020) 4858–4872. [DOI] [PubMed] [Google Scholar]
- [55].Pizzuti VJ, Misra R, Lee J, Torregrosa-Allen SE, Currie MP, Clark SR, Patel AP, Schorr CR, Jones-Hall Y, Childress MO, Plantenga JM, Rancilio NJ, Elzey BD, Won Y-Y, Folic Acid-Conjugated Radioluminescent Calcium Tungstate Nanoparticles as Radio-Sensitizers for Cancer Radiotherapy, ACS Biomaterials Science & Engineering, 5 (2019) 4776–4789. [DOI] [PubMed] [Google Scholar]
- [56].Patil S, Yoo J, Won Y-Y, Investigation of the Mechanisms and Kinetics of DBU-Catalyzed PLGA Copolymerization via a Full-Scale Population Balance Analysis, Industrial & Engineering Chemistry Research, 60 (2021) 14685–14700. [Google Scholar]
- [57].Sherck NJ, Kim HC, Won Y-Y, Elucidating a Unified Mechanistic Scheme for the DBU-Catalyzed Ring-Opening Polymerization of Lactide to Poly(lactic acid), Macromolecules, 49 (2016) 4699–4713. [DOI] [PMC free article] [PubMed] [Google Scholar]
- [58].Yoo J, Viswanath D, Won Y-Y, Strategy for Synthesis of Statistically Sequence-Controlled Uniform PLGA and Effects of Sequence Distribution on Interaction and Drug Release Properties, ACS Macro Letters, 10 (2021) 1510–1516. [DOI] [PubMed] [Google Scholar]
- [59].Chmurny GN, Hilton BD, Brobst S, Look SA, Witherup KM, Beutler JA, 1H- and 13C-nmr Assignments for Taxol, 7-epi-Taxol, and Cephalomannine, Journal of Natural Products, 55 (1992) 414–423. [DOI] [PubMed] [Google Scholar]
- [60].Harwood JS, Bruker AV-III / Avance DRX NMR Spectrometers running TopSpin Routine/Survey 2D Spectra using Standard Parameter Sets, in, 2017. [Google Scholar]
- [61].Mei Zhao DS, Pickering Curtis R., Jasser Samar A., Henderson Ying C., Clayman Gary L., Sturgis Erich M., Ow Thomas J., Lotan Reuben, Carey Thomas E., Sacks Peter G., Grandis Jennifer R., Sidransky David, Heldin Nils Erik, and Myers Jeffrey N., Assembly and initial characterization of a panel of 85 genomically validated cell lines from diverse head and neck tumor sites, Clinical cancer research : an official journal of the American Association for Cancer Research, 17 (2011) 7248–7264. [DOI] [PMC free article] [PubMed] [Google Scholar]
- [62].Yew GH, Mohd Yusof AM, Mohd Ishak ZA, Ishiaku US, Water absorption and enzymatic degradation of poly(lactic acid)/rice starch composites, Polymer Degradation and Stability, 90 (2005) 488–500. [Google Scholar]
- [63].Buckley K, Ryder AG, Applications of Raman Spectroscopy in Biopharmaceutical Manufacturing: A Short Review, Appl Spectrosc, 71 (2017) 1085–1116. [DOI] [PubMed] [Google Scholar]
- [64].Renuga Ta.S. G, FTIR And FT-Raman spectral analysis of Paclitaxel drugs, International Journal of Pharmaceutical Sciences Review and Research, 2 (2010). [Google Scholar]
- [65].Solvent- and Concentration-Dependent Molecular Interactions of Taxol (Paclitaxel †), Journal of Pharmaceutical Sciences, 83 (1994) 1470 – 1476. [DOI] [PubMed] [Google Scholar]
- [66].Khames A, Investigation of the effect of solubility increase at the main absorption site on bioavailability of BCS class II drug (risperidone) using liquisolid technique, Drug Deliv, 24 (2017) 328–338. [DOI] [PMC free article] [PubMed] [Google Scholar]
- [67].N.C.f.B. Information, PubChem Comp ound Summary for CID 36314, Paclitaxel, in, 2021. [Google Scholar]
- [68].van Vlerken LE, Duan Z, Little SR, Seiden MV, Amiji MM, Biodistribution and pharmacokinetic analysis of paclitaxel and ceramide administered in multifunctional polymer-blend nanoparticles in drug resistant breast cancer model, Molecular Pharmaceutics, 5 (2008) 516–526. [DOI] [PMC free article] [PubMed] [Google Scholar]
- [69].Boulin M, Guiu S, Chauffert B, Aho S, Cercueil JP, Ghiringhelli F, Krause D, Fagnoni P, Hillon P, Bedenne L, Guiu B, Screening of anticancer drugs for chemoembolization of hepatocellular carcinoma, Anticancer Drugs, 22 (2011) 741–748. [DOI] [PubMed] [Google Scholar]
Associated Data
This section collects any data citations, data availability statements, or supplementary materials included in this article.