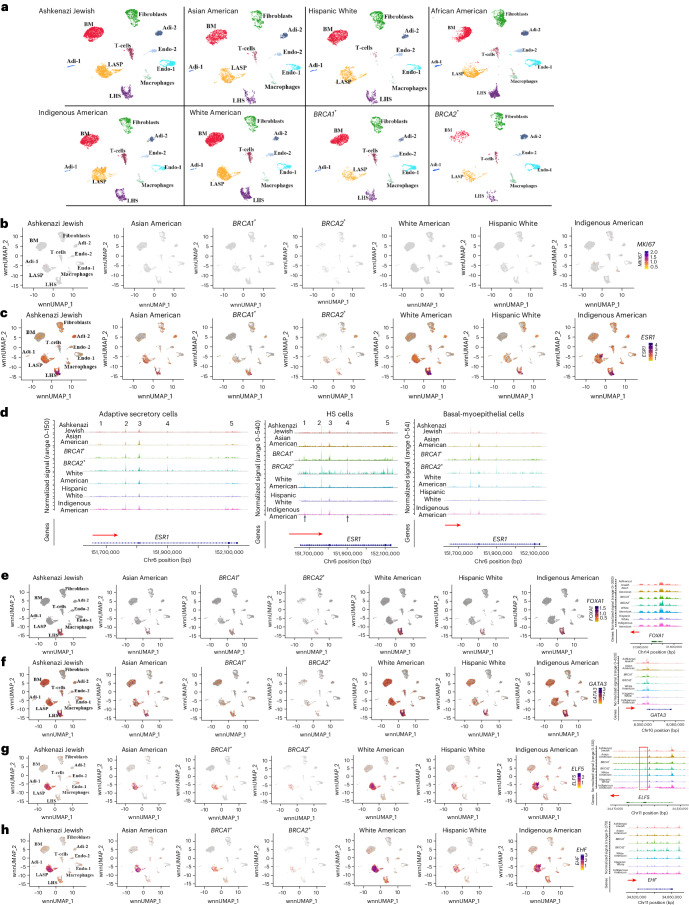
Fig. 4. Genetic ancestry-dependent variability in cell state.
a, Cell clustering in each group based on integrated snATAC-seq and snRNA-seq analyses. b, Expression pattern of the cell proliferation marker MKI67. c, ESR1 expression showed genetic ancestry-dependent variability with a subpopulation of LASP cells in Indigenous Americans expressing ESR1. d, ESR1 gene chromatin accessibility patterns in LHS, LASP and BM cells of various genetic ancestry groups, and BRCA1 and BRCA2 mutation carriers. e, FOXA1 expression and FOXA1 gene chromatin accessibility patterns in several genetic ancestry groups, and BRCA1 and BRCA2 mutation carriers. f, GATA3 expression and chromatin accessibility patterns in several genetic ancestry groups, and BRCA1 and BRCA2 mutation carriers. g, ELF5 expression and chromatin accessibility patterns in several genetic ancestry groups, and BRCA1 and BRCA2 mutation carriers. The red vertical box shows a chromatin-accessible peak unique to the cells of the BRCA2 mutation carrier. h, EHF expression and chromatin accessibility patterns in several genetic ancestry groups, and BRCA1 and BRCA2 mutation carriers.

