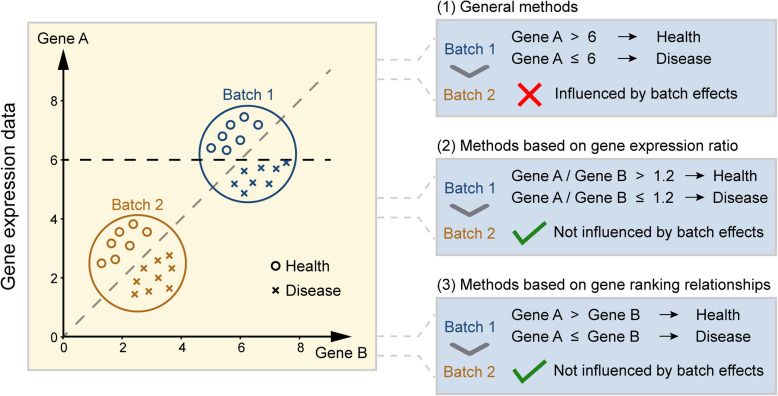
Fig. 1.
Illustration of batch effects in gene expression profiles. Gene expression profiles from two batches (blue and brown) were used to distinguish disease (cross) from healthy control (circle) samples. The X-axis and Y-axis represent the expression levels of genes B and A, respectively. In Batch 1, a fixed threshold for Gene A’s expression level (e.g., Gene A > 6) can effectively classify samples as healthy or diseased. However, this approach fails in Batch 2, highlighting the influence of batch effects when relying on absolute expression levels of specific genes. In contrast, methods based on relative changes between two genes, such as relative expression rankings or ratios, are robust to batch effects and yield consistent classification results across both batches. For instance, in both Batch 1 and Batch 2, a sample is classified as healthy if the expression value of Gene A is consistently higher than Gene B; otherwise, it is classified as diseased

