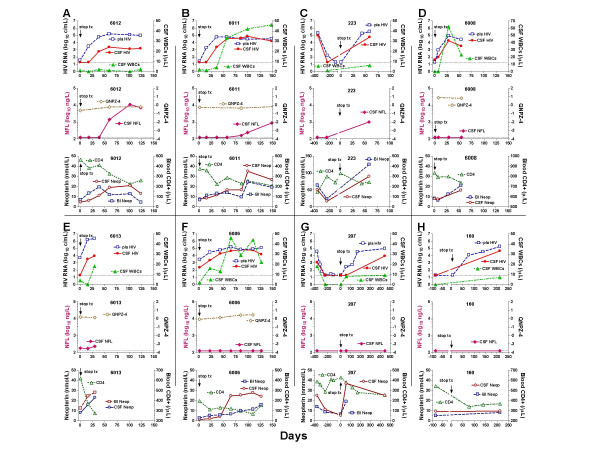
Figure 1.
Time course of changes in salient laboratory findings in the eight subjects (A-H). Sets of three graphs for each subject arranged within eight panels (the top graph in each panel shows the changes in plasma and CSF HIV RNA and CSF WBCs, the center graph the NFL and QNPZ-4 for those with this assessment, and the bottom graph the blood and CSF neopterin and blood CD4+ T cell counts).

