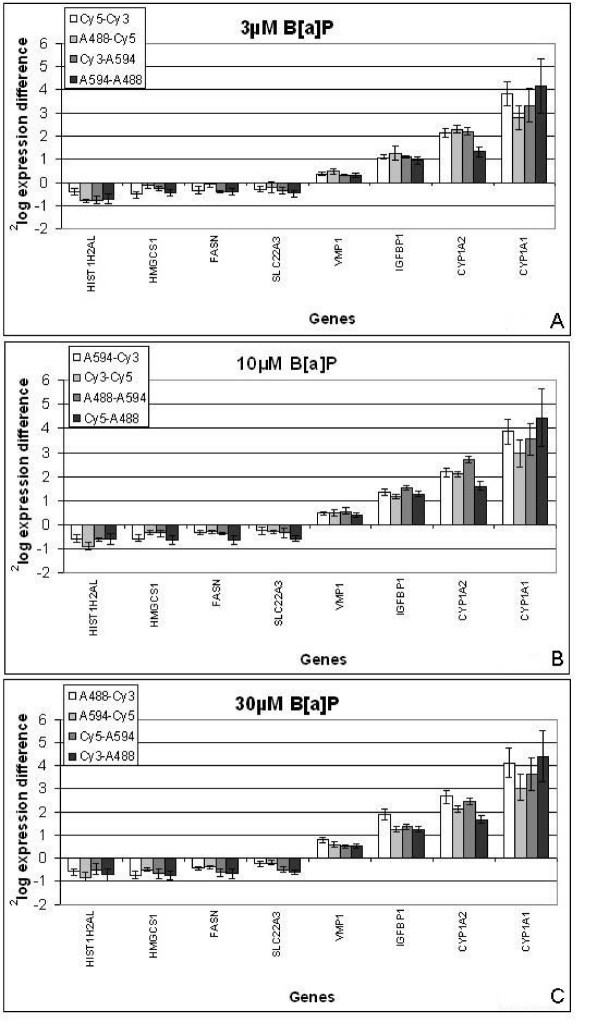
Figure 4.
(A) Gene expression difference for several genes after exposure of HepG2 cells to 3 μM B[a]P during 6 h. Gene expression difference for several genes, in varying relative gene expression level of high (FASN and HIST1H2AL), middle (CYP1A2, HMGCS1, VMP1 and IGFBP1) and low (CYP1A1, SLC22A3), as measured by different dye combinations by using four dyes simultaneously on cDNA microarrays in RNA samples from HepG2 cells exposed to 3 μM B[a]P during 6 hours. Error bars indicate the standard deviation for the replicate spots. (B) Gene expression difference for several genes after exposure of HepG2 cells to 10 μM B[a]P during 6 h. Gene expression difference for several genes, in varying relative gene expression level of high (FASN and HIST1H2AL), middle (CYP1A2, HMGCS1, VMP1 and IGFBP1) and low (CYP1A1, SLC22A3), as measured by different dye combinations by using four dyes simultaneously on cDNA microarrays in RNA samples from HepG2 cells exposed to 10 μM B[a]P during 6 hours. Error bars indicate the standard deviation for the replicate spots. (C) Gene expression difference for several genes after exposure of HepG2 cells to 30 μM B[a]P during 6 h. Gene expression difference for several genes, in varying relative gene expression level of high (FASN and HIST1H2AL), middle (CYP1A2, HMGCS1, VMP1 and IGFBP1) and low (CYP1A1, SLC22A3), as measured by different dye combinations by using four dyes simultaneously on cDNA microarrays in RNA samples from HepG2 cells exposed to 30 μM B[a]P during 6 hours. Error bars indicate the standard deviation for the replicate spots.

