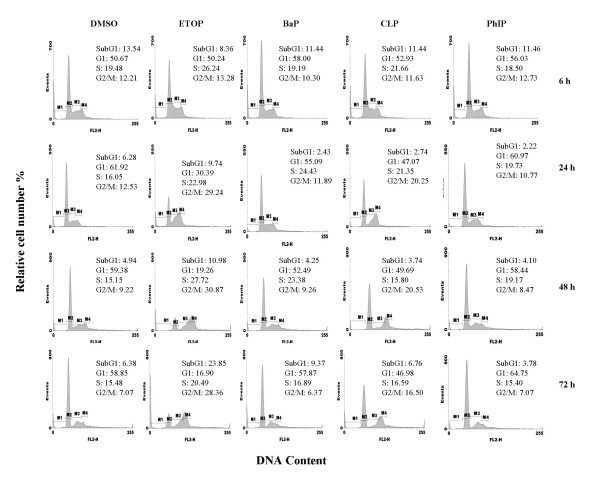
Figure 1.
Effects of chemical treatment on cell cycle. A549 cells were treated with DMSO (< 0.1% v/v), etoposide (10 μM), BaP (25 μM), CLP (2.5 μM) or PhIP (50 μM) for the times indicated. Cell cycle distribution was assessed by flow cytometry. The gating represents % cells in each phase of the cell cycle. M1: sub-G1; M2:G0/G1 phase; M3: S phase; M4: G2/M phase.

