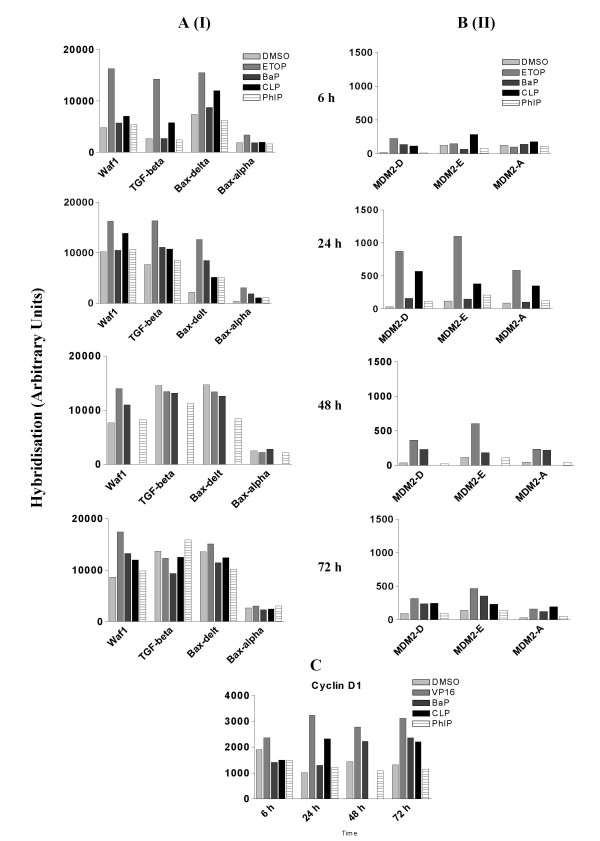
Figure 3.
Effects of chemical treatment on mRNA levels of p53 target genes and cyclin D1 in A549 cells that were treated as described in Fig. 1 were measured using cDNA microarray hybridisation. A. p53 transcriptional targets (I). B. p53 transcriptional targets (II). C. Cyclin D1. GenBank accession number for each gene is displayed in table 1.

