
Figure 1.
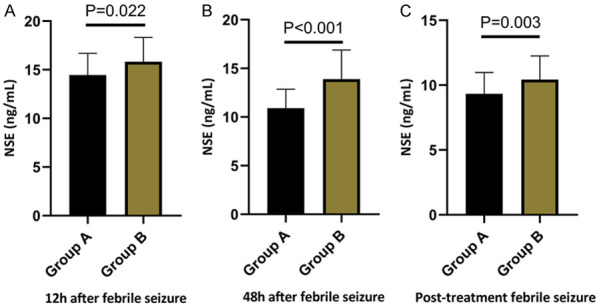
Comparison of NSE levels between the two groups at 12, 48 hours post-seizure and post-treatment. A: Comparison of NSE levels between the two groups at 12 h after febrile seizure. B: Comparison of NSE levels between the two groups at 48 h after febrile seizure. C: Comparison of NSE levels between the two groups after treatment. Note: NSE, neuron-specific enolase; SFS, Simple febrile seizure; CFS, Complex febrile seizure.