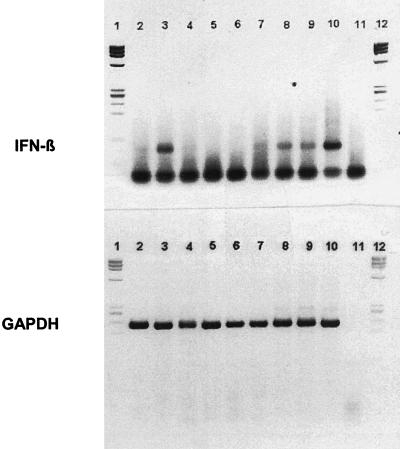
FIG. 3.
IFN-β expression by alveolar macrophages, as analyzed by RT-PCR. One hour after exposure to Ebola virus (lane 3), cells expressed IFN-β mRNA at significantly increased levels over mock-infected cells. However, by 2 h postexposure, the expression of IFN-β was markedly reduced (lane 6) (observed in two of four monkeys). In the other two monkeys, Ebola virus infection failed to stimulate any IFN-β production (data not shown). GAPDH was used as an internal control. Lane 1 and 12, molecular weight markers; lane 2, T0 mock-infected cells; lane 3, T0 Ebola virus-infected cells; lane 4, T2 LPS-stimulated cells; lane 5, T2 mock-infected cells; lane 6, T2 Ebola virus-infected cells; lane 7, T6 LPS-stimulated cells; lane 8, T6 mock-infected cells; lane 9, T6 Ebola virus-infected cells; lane 10, LPS-stimulated peripheral blood mononuclear cells (positive control); lane 11, no-template control (NTC).

