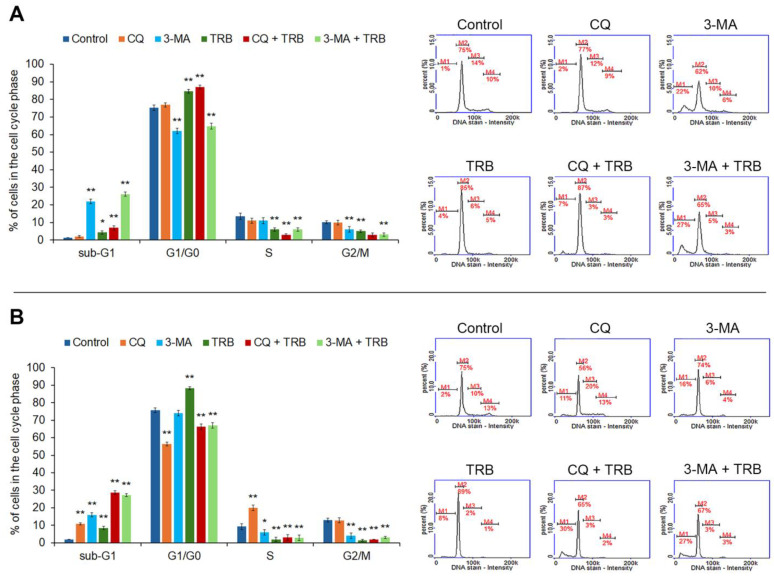
Figure 3.
Cytometric cell cycle analysis of C32 (A) and A-375 (B) cells treated with chloroquine (CQ) in a concentration of 50 µM, 3-methyladenine (3-MA) in a concentration of 5 mM, or/and trametinib (TRB) in a concentration of 50 nM. The left panel bars represent a mean ± SD (standard deviation) of three independent experiments in at least triplicate; * p < 0.05, ** p < 0.01 vs. control. In the right panel, representative histograms showing the cells in sub-G1(M1), G1/G0 (M2), S (M3) and G2/M (M4) phases are presented.

