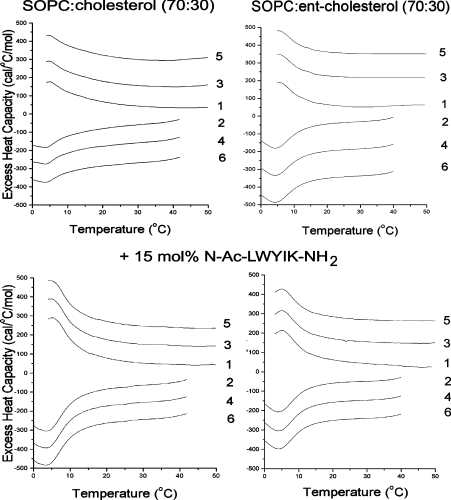
Figure 3. DSC of SOPC:cholesterol (7:3) (left panels) or SOPC:ent-cholesterol (7:3) (right panels) with or without 15 mol% N-acetyl-LWYIK-amide.
The scan rate was 2K/min and the lipid concentration was 2.5 mg/ml in 20 mM Pipes containing 1 mM EDTA and 150 mM NaCl supplemented with 0.002% NaN3, pH 7.4. Sequential heating and cooling scans between 0 and 50 °C are shown. Numbers are the order in which the scans were carried out, with scans 1, 3 and 5 being heating scans, each of which was followed by one of the cooling scans 2, 4 or 6. Scans were displaced along the y-axis for clarity of presentation. Ac, acetyl; 1 cal=4.184 J.

