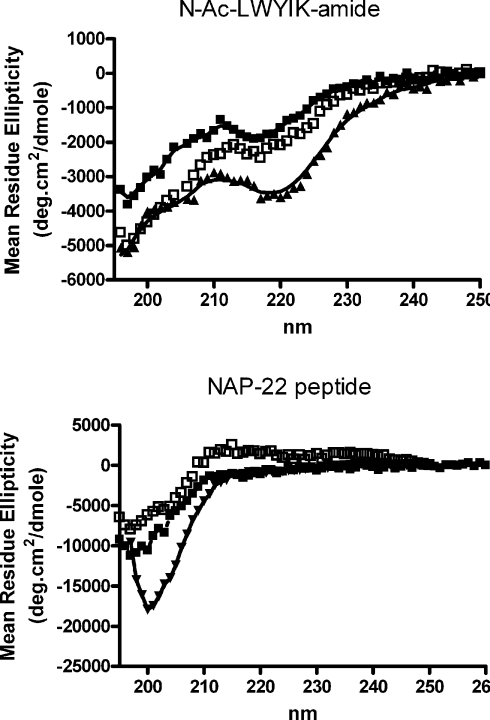
Figure 6. CD spectra of 150 μM N-acetyl-LWYIK-amide (top panel) or 150 μM NAP-22 peptide (bottom panel).
CD spectra were run of samples in a 1 mm cell at 25 °C; the buffer comprised 10 mM sodium phosphate/140 mM NaCl. Shown are traces of peptide in buffer alone (▲), or with the addition of 500 μM sonicated unilamellar vesicles of SOPC:cholesterol (1:1; □) or SOPC:ent-cholesterol (1:1; ■).

